Dividend Yield Calculator
Get forward and trailing yield side by side, plus yield on cost, payout ratio, and projected income. The calculator flags a yield trap when a high yield isn't covered by earnings.
 AAPL
AAPLForward dividend yield
$0.27 × 4× per year = $1.10 annually, on a $27.85 share price.
dividends per share
+12.7% CAGRWhat is Dividend Yield?
Dividend Yield changes constantly because stock prices move every trading day, while dividends are typically paid quarterly or annually and typically don't change much year to year.
Dividend Yield Formula
For example, if a company pays $2.00 per share annually and the stock trades at $50, its Dividend Yield is 4%.
Why investors use Dividend Yield
- Compare dividend-paying stocks
- Estimate annual passive income
- Build income-focused portfolios
- Evaluate dividend sustainability alongside payout ratios
- Compare investments with bonds or savings accounts
Is a higher Dividend Yield always better?
An unusually high dividend yield can sometimes signal financial trouble. If a company's stock price falls sharply while the dividend stays the same, the yield rises automatically, even if the dividend may soon be reduced.
That's why Dividend Yield should always be analyzed alongside earnings, free cash flow, payout ratio, and dividend growth history.
Dividend Yield Formula, two inputs are all you need
The standard Dividend Yield formula is:
Apple's Dividend Yield Calculation Example, line by line
Here's how Dividend Yield is calculated using Apple's stock.

Apple Inc.
Find the Annual Dividend
Apple currently pays approximately $1.10 per share annually ($0.2745 × 4 quarterly).
Find the Current Share Price
Assume Apple is trading at $27.85 per share.
Apply the Formula
Dividend Yield = Annual Dividend ÷ Share Price
Convert to Percentage
Multiply by 100.
Five mistakes that lead to misleading Dividend Yield calculations
If your Dividend Yield looks unusually high or low, one of these common mistakes is often the reason.
Using quarterly dividends instead of annual dividends
Always use the total annual dividend per share.
Using an outdated share price
Always calculate Dividend Yield using the latest available market price.
Assuming a high yield means a better investment
Always investigate why the yield is unusually high.
Ignoring dividend sustainability
Review earnings, payout ratio, and free cash flow to determine whether dividends are likely to continue.
Comparing yields across different industries
Compare Dividend Yield with companies in the same sector for more meaningful analysis.
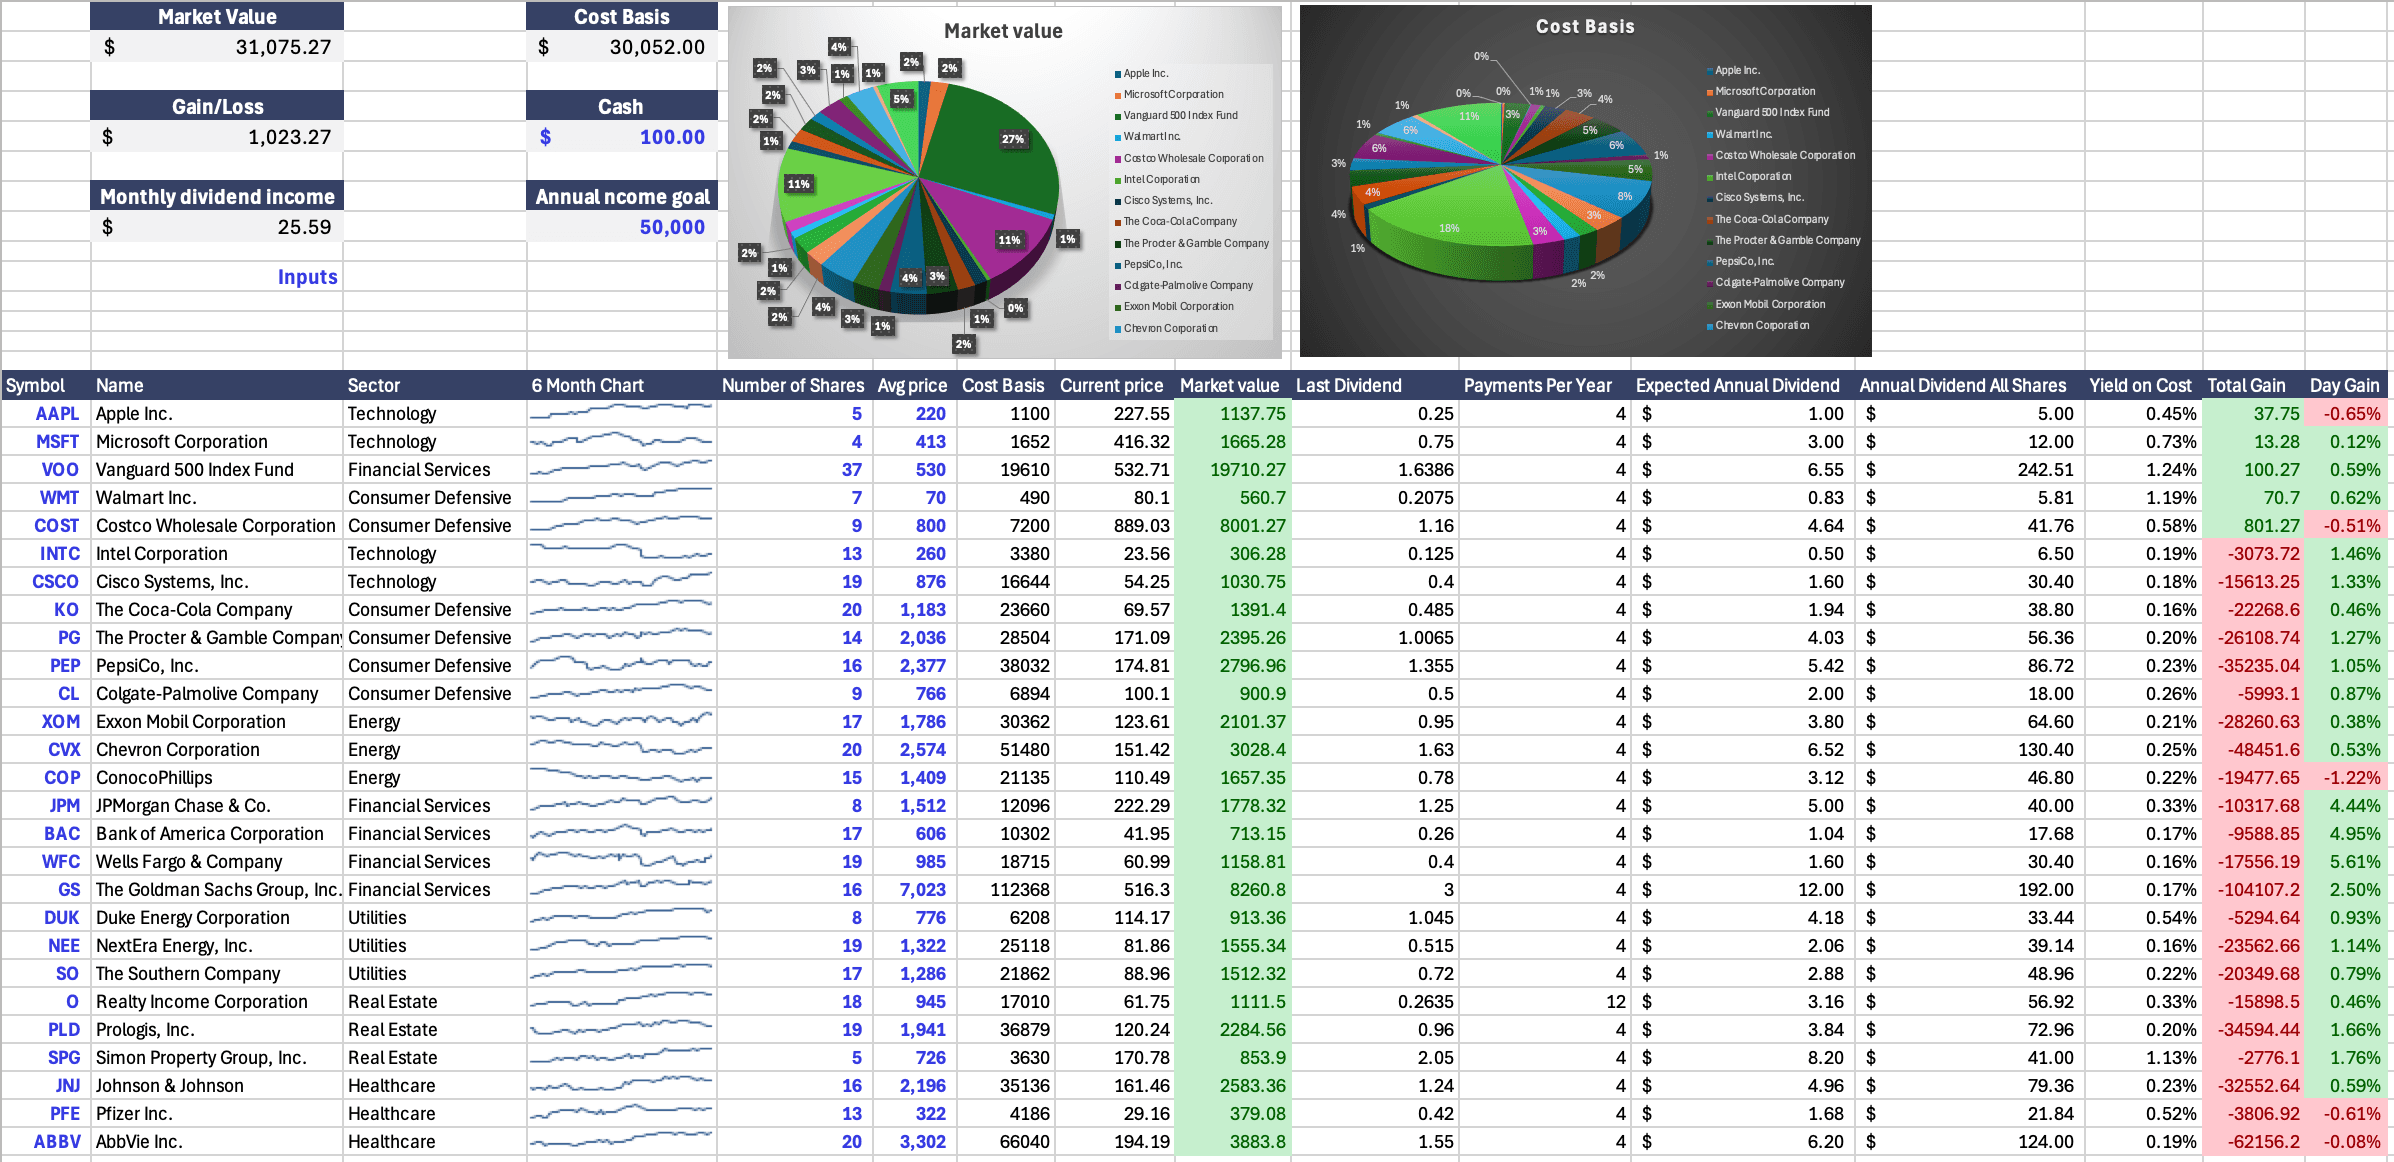
Frequently asked questions

Want To Do This In Your Own Spreadsheet?
Wisesheets lets you create a model in your spreadsheet where you change the ticker and all of the data automatically updates for you.
Get Free Trial