The Fastest and Most Powerful Way to Build
with Financial Data
No APIs. No scraping. No maintaining and building databases. Just pure SQL.
Direct access to our maintained and scalable database — 30+ years of company financials, metrics, and more.
Run queries. Get results. Build anything.
130M+
Data requests
served monthly
80K+ Stocks & ETFs
Comprehensive coverage across
50+ global exchanges
Native SQL Queries
No complex APIs - just simple,
familiar syntax
30+ Years History
From 1990 to today. Clean,
structured, and reliable
Trusted By Professionals At Over 1,000 Firms


Built for Builders, Made for Scale
Wisesheets connects you directly to the source — no middleware, no complex api calls, no abstractions.
Just your SQL client and the truth.
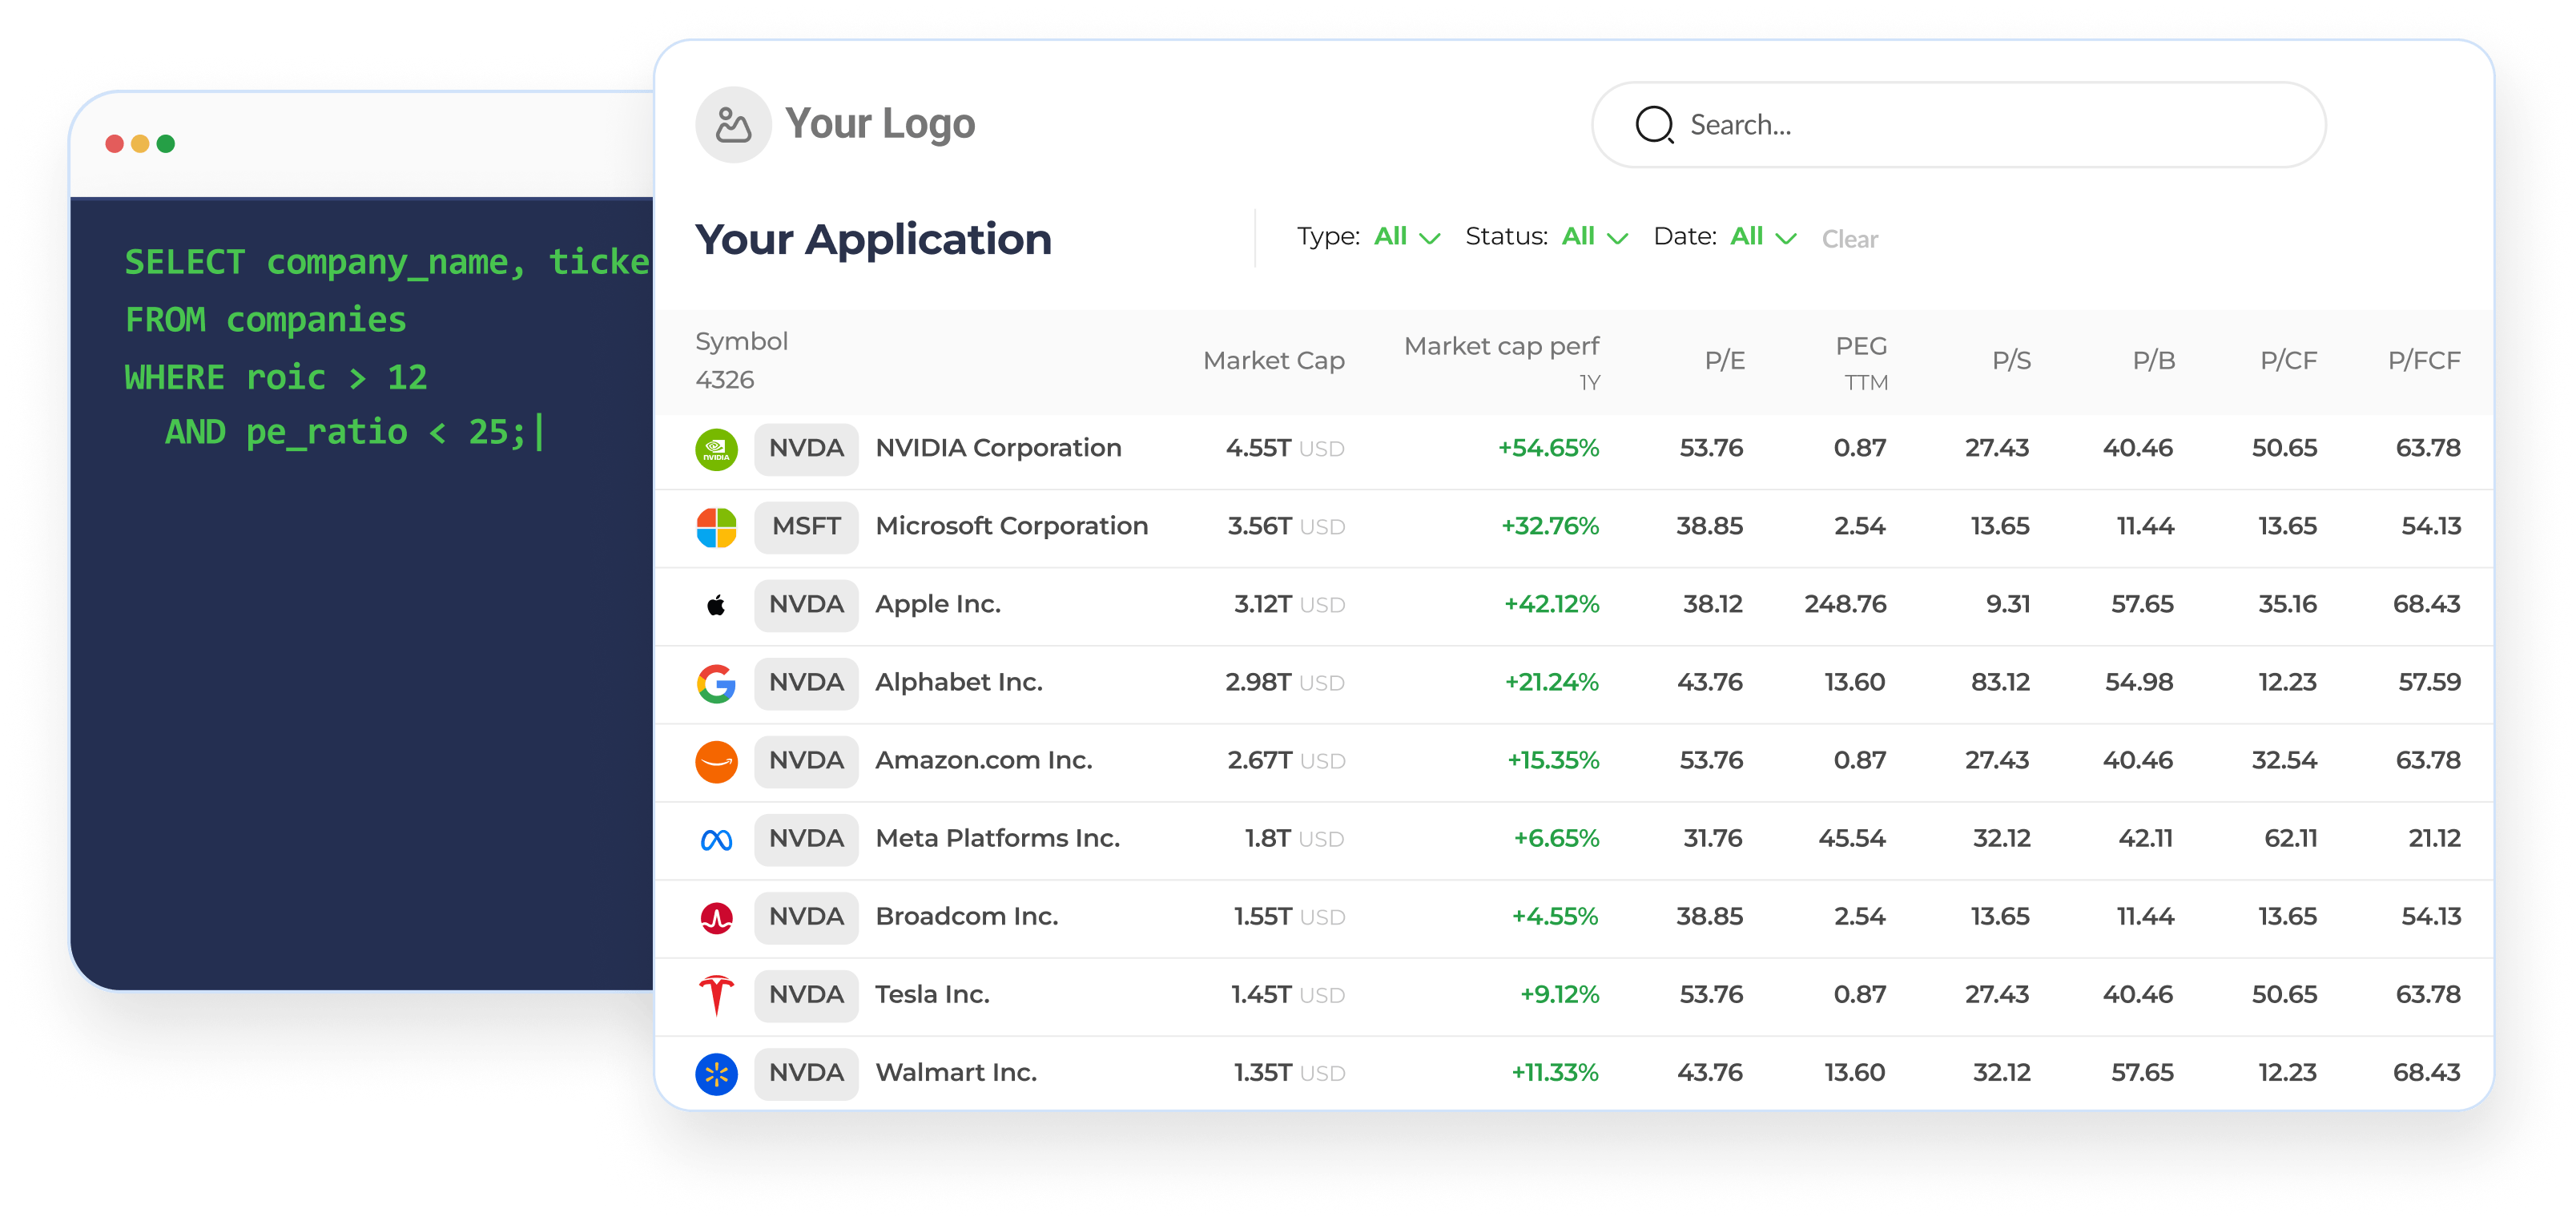
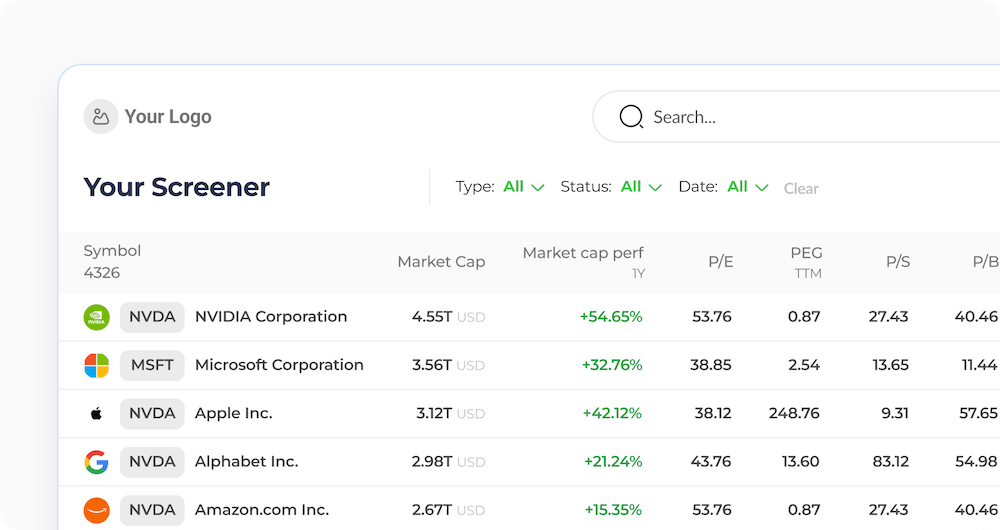
Searchable With SQL
Query exactly the data build powerful screeners and other applications only possible via SQL queries.
SELECT ticker, revenue, net_income
FROM income_statements
WHERE revenue > 100000000000
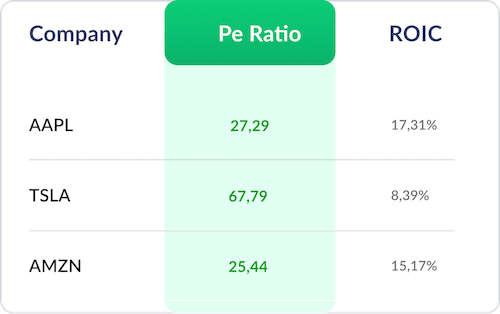
ORDER BY revenue DESC;Key Metrics & Ratios
Revenue growth, P/E, ROIC, margins, and hundreds more — pre-computed and instantly filterable.
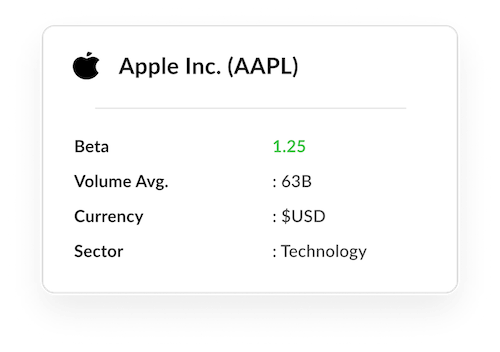
Company Profile Data
Sector, industry, employee count, exchange listings, and more.
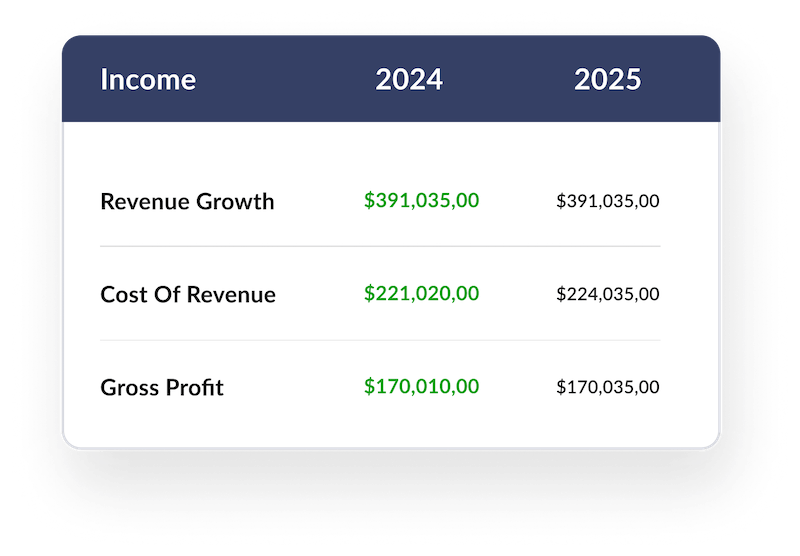
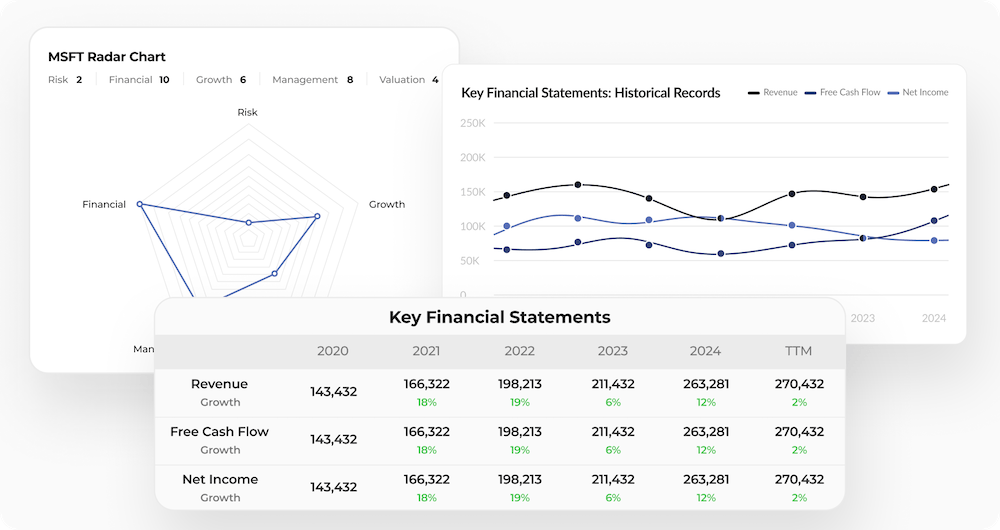
30+ Years of Financial Statements
Income statements, balance sheets, and cash flow statements — clean and normalized across 50,000+ stocks.
Massive Coverage
50+ global exchanges, 50K+ equities, 130M+ data points served monthly.

How It Works
Connect to the Database
We send you credentials. You connect using your favorite SQL client or BI tool.
Query What You Want
Filter for companies, metrics, or time periods with simple queries like:
Build Without Barriers
Use the data to power apps, platforms, reports, bots, or internal tools.
SELECT date, revenue, grossProfit, operatingIncome, netIncome, EPS, costOfRevenue, operatingExpenses
FROM annual_income_statement
WHERE symbol = 'AAPL'
ORDER BY date DESC
LIMIT 8;| ID | Ticker | Date | Revenue | Gross Profit | Operating Income | Net Income | EPS | Cost of Revenue | Operating Expenses |
|---|---|---|---|---|---|---|---|---|---|
| 1 | AAPL | 2024-09-28 | 391.0B | 180.7B | 123.2B | 93.7B | 6.11 | 210.4B | 57.5B |
| 2 | AAPL | 2023-09-30 | 383.3B | 169.1B | 114.3B | 97.0B | 6.16 | 214.1B | 54.8B |
| 3 | AAPL | 2022-09-24 | 394.3B | 170.8B | 119.4B | 99.8B | 6.15 | 223.5B | 51.6B |
| 4 | AAPL | 2021-09-25 | 365.8B | 152.8B | 108.9B | 94.7B | 5.67 | 213.0B | 43.8B |
| 5 | AAPL | 2020-09-26 | 274.5B | 105.0B | 66.3B | 57.4B | 3.31 | 169.6B | 38.8B |
| 6 | AAPL | 2019-09-28 | 260.2B | 98.4B | 63.9B | 55.3B | 2.99 | 161.8B | 34.0B |
| 7 | AAPL | 2018-09-29 | 265.6B | 101.8B | 70.9B | 59.5B | 3.00 | 163.8B | 31.4B |
| 8 | AAPL | 2017-09-30 | 229.2B | 88.2B | 61.3B | 48.4B | 2.32 | 141.0B | 27.0B |
Use Cases
Unlike traditional APIs, our service allows you to build exceptionally powerful applications by querying our entire universe of stocks and retrieving only the precise data you need.
Stock Screeners & Research Platforms
Run advanced filters on valuation, fundamentals, or price data.
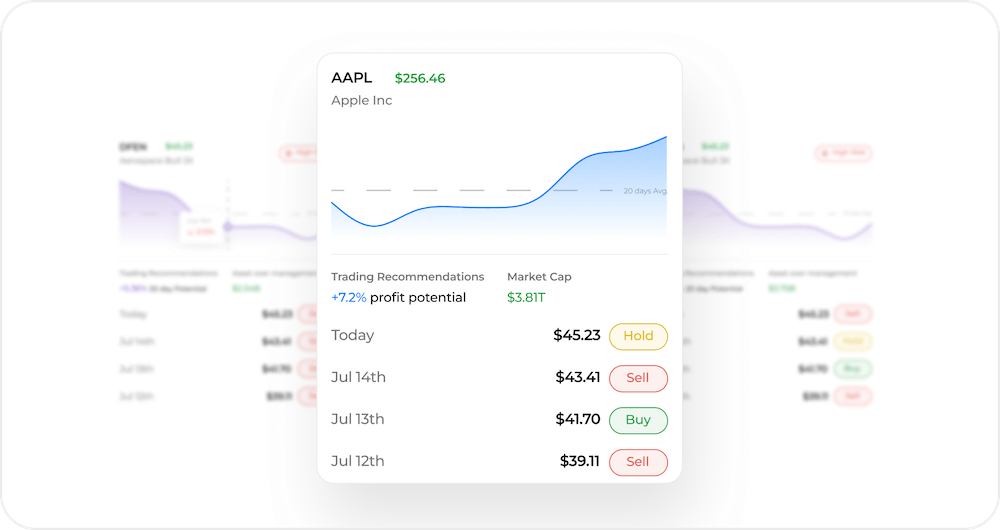
Automated Investing Tools
Feed clean historical and live financials into trading systems.
Custom Dashboards & Analytics
Build internal tools or public-facing dashboards in minutes.
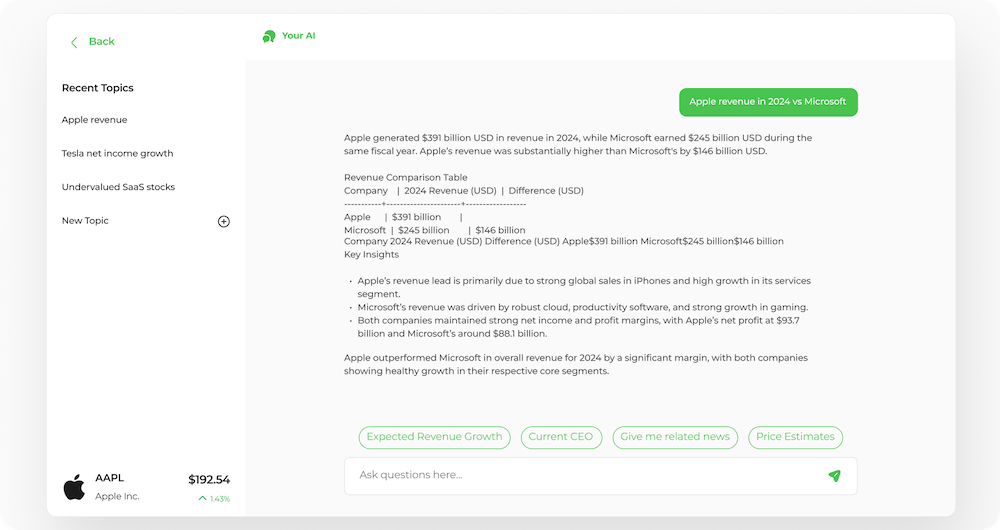
Data Bots & Web Apps
Power your Reddit bot, newsletter, or Substack with fresh financials.
Why Customers Love It
Pricing Tailored to Your Needs and Scale
Whether you're just getting started or managing high-volume requests, our flexible plans grow with you.
Only pay for what you need — no bloated bundles, no unnecessary extras.
Business Plan
Direct access to SQL database
30 Year of historical financial data
All financial statements and key metrics
Covering 50+ stock exchanges
Dedicated slack channel support
Commercial use license
Company profile data
99% SLA guarantee