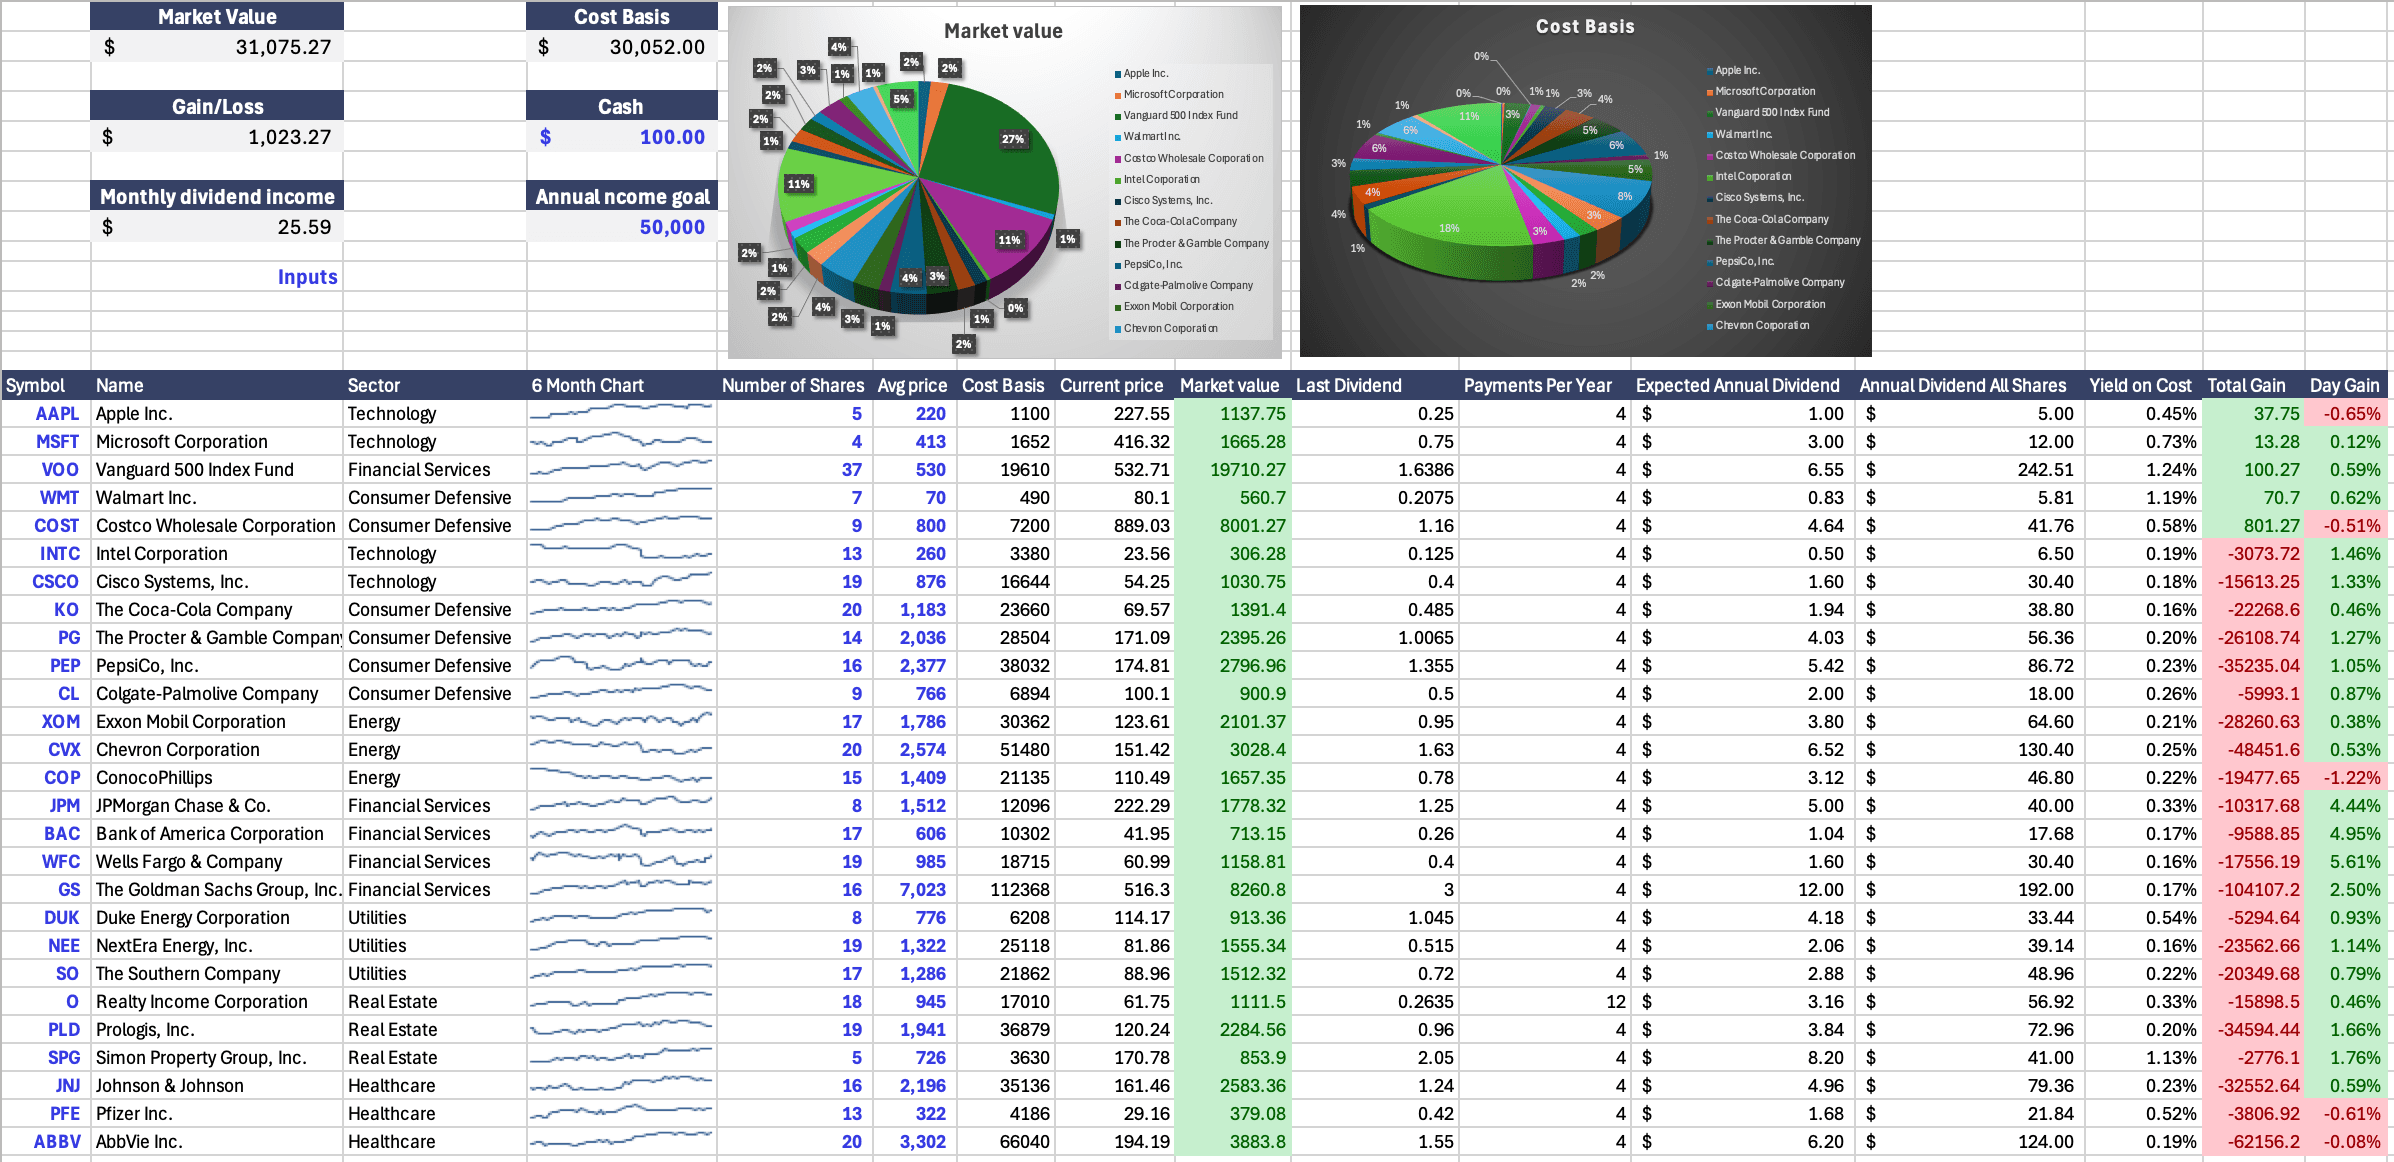
The dividend drip calculator that shows the snowball.

Type any dividend stock and explore the effect of reinvested dividends compounded year by year. See the division and see the year-by-year dividends estimate to replace your salary.

By Guillermo Valles
Updated May 24, 2026
AAPL LogoAAPL
or
Initial Investment
$
Dividend Yield
%
DIV Growth Rate
%
Price Appreciation
%
Time Horizon
Yrs
Monthly Contribution
$

Portfolio value

Principal contributed
Capital appreciation
Reinvested dividends
Final Portfolio Value
$849,584
After 10 years
Annual Passive Income
$84,859
$7,072 / month at year 10
Yield on Cost
25.91%
12.00% starting yield · 2.2x growth
With DRIP$849,584Every dividend reinvested into new shares
DRIP ADDS
+$350,963Meaningful gap opens in Year 3
Without DRIP$498,622Portfolio + cumulative cash dividends received
Show your work

Year by year, line by line

Every dollar is reinvested, many shares purchased every year of compounding. The table updates as you change inputs above.

YearSharesDiv/ShareDRIP FundsShares AddedPortfolio ValueYield
Year 11,149.84$12.96$13,395+127.04$126,48312.96%
Year 21,313.49$14.00$16,575+142.92$158,93214.00%
Year 31,492.15$15.12$20,388+159.82$198,60615.12%
Year 41,687.1$16.33$24,951+177.81$247,00816.33%
Year 51,899.63$17.63$30,401+196.96$305,93817.63%
Financial Independence Calculator

What year does your dividend income actually replace your paycheck?

Set your monthly expense target and we will find the year your dividend income from this scenario covers it. This is one of the key numbers that matters in dividend investing.

$/month
Year you reach FI
Year 4
Foundations

What DRIP actually does to your wealth.

A dividend reinvestment plan or drip plan takes every cash dividend a company pays you and converts it back into more shares of that company, usually with no commission and sometimes at a small discount. The mechanics are simple but the results are not. Each new share you receive will pay its own dividend forever, and the dividend will likely grow, and those dividends will buy more shares, until time itself has compounded and your initial investment turns into something you couldn’t have predicted.

The conventional way to describe this is the snowball metaphor that Warren Buffett popularized. A small ball rolling down a long hill picks up snow on every roll, and the longer the hill, the larger the ball at the bottom. With dividend reinvestment, the hill is time and the snow is the yield. The two variables that determine how big the snowball gets are the starting size and how long you let it roll.

The two numbers that actually matter

Most investors fixate on the starting dividend yield. They scan for stocks paying 5% or 6% and assume those will compound faster than a 2.5% payer. This is usually wrong. Over a 25 year horizon, a stock with a 2.5% starting yield growing dividends at 8% per year ends up with a higher yield on cost than a stock with a 5% starting yield growing at 2%. The dividend growth rate compounds. The starting yield does not.

The second number is time. DRIP rewards patience non-linearly. The difference between a 10 year hold and a 15 year hold is not 50% more wealth. With reasonable inputs, it is often double. The reinvested dividends added in the back half of the horizon dwarf everything that happened in the first half, because those dividends are being paid on a much larger share count.

Yield on cost is the metric you should track

Yield on cost (YoC) is your current annual dividend per share divided by the price you originally paid. After 25 years of holding Coca-Cola with reinvested dividends, the yield you receive on every dollar you invested back in 2001 is north of 15%. That number is invisible from a stock screener. It only appears once you have actually held the position. Tracking YoC is how dividend investors stay sane during drawdowns. The stock price wobbles while the yield on cost only slowly moves up.

Worked Example

Coca-Cola, 1995 to 2025.

A real position held for thirty years. Using actual dividend history. This is what the calculator above would have shown someone in January 1995.

Coca-Cola Logo

Coca-Cola, 1995 to 2025.

KONYSE62 consecutive years of dividend increases
STEP 01

Initial position, January 1995

Price: $25.75
Initial investment: $10,000
Starting shares: 388
Starting dividend: $0.44 / share
Starting yield: 1.71%

→ 388 Shares
STEP 02

Annual reinvestment, every quarter

Each quarter, dividends are paid in cash Dividends. These dividends purchase fractional new shares.
The new shares earn their own dividends and process repeats for 30 years (120 reinvestments)

→ Compounding loop
STEP 03

Position at end, January 2025

Ending price: $63.50
Shares accumulated: 1,224 shares (+836 from DRIP)
Dividends reinvested: $27,450 total
Total portfolio value: $77,724 (vs $24,632 with no DRIP)
Ending annual income: $2,350 / year

→ $77,724 Value (+215% vs no DRIP)
STEP 04

Yield on cost, today

Your original investment: $10,000
Your current annual income: $2,350
Your yield on cost: 23.5%
(Standard yield today: 3.10%)

→ 23.5% Yield on Cost
Reference

The Dividend Aristocrats, ranked by 5yr DGR.

S&P 500 companies that have raised dividends for 25 or more consecutive years. Click any row to model that stock in the calculator above.

CompanyYield5YR DGRPayoutYears
LOW
Lowe's Companies
Home Improvement Retail
1.9%19.0%32%51
MCD
McDonald's Corp.
Quick Service Restaurants
2.4%7.2%55%49
ABBV
AbbVie Inc.
Pharmaceuticals
3.7%8.0%48%54
PEP
PepsiCo Inc.
Consumer Staples
4.0%6.1%79%54
CVX
Chevron Corp.
Integrated Oil & Gas
2.4%5.6%62%39
PG
Procter & Gamble
Consumer Staples
2.7%5.6%52%70
JNJ
Johnson & Johnson
Pharmaceuticals
3.7%4.2%42%64
KO
The Coca-Cola Co.
Consumer Staples
1.9%3.0%62%64
KMB
Kimberly-Clark
Consumer Staples
4.0%3.5%76%54
Pitfalls

Six mistakes that destroy your snowball.

If your DRIP scenario underperforms expectations, one of these is almost always the reason.

Mistake 01

Chasing yield, ignoring growth

A 6% starting yield with 1% growth is strictly worse than a 3% starting yield with 7% growth over any horizon longer than 12 years. Dividend growth rate is the dominant variable. High starting yields often tell you a dividend cut is coming.

Mistake 02

The yield trap

When a stock's yield jumps to 9% or 10%, the market is usually pricing in a dividend cut. Frontier Communications, AT&T in 2022, and General Electric are textbook examples. Always check the payout ratio. If it exceeds 80% outside of REITs and utilities, the dividend is in danger.

Mistake 03

Forgetting taxes in a taxable account

Reinvested dividends are still taxable income in the year received, even though you never saw the cash. At a 15% qualified rate, your effective compounding rate is reduced by roughly 45 basis points per year on a 3% yielder. Hold dividend stocks in tax advantaged accounts when possible.

Mistake 04

Mixing nominal and real returns

A 7% nominal return at 2.5% inflation is only 4.4% real. Twenty years of inflation compounds. If you are planning retirement income in today's dollars, run the calculator with the inflation adjustment toggle on and discount your future income accordingly.

Mistake 05

Assuming the dividend growth rate never declines

A 25 year linear projection of 10% DGR is fantasy. Companies mature and DGR decays. Coca-Cola grew dividends at 13% in the 1990s. It now grows them at 4%. Use the trailing 5 year DGR for the first decade and converge toward the industry average thereafter.

Mistake 06

Single stock concentration

A perfect DRIP scenario for one stock means nothing if that company cuts the dividend in year 12. Diversify across at least 15 to 20 dividend payers across different sectors, with no single position exceeding 8% of the portfolio. The math in the calculator assumes the dividend keeps growing. Diversification is how you make that assumption survive contact with reality.

Frequently asked questions

Guillermo Valles

Guillermo Valles

FounderWisesheetsFormer Financial Analyst

Guillermo built Wisesheets after spending years pulling data into spreadsheets the slow way. The calculator above uses the same data feed that powers the Wisesheets Excel add in, drawing from SEC filings via XBRL and reconciled market data. The methodology is audited quarterly.

Track This Portfolio In Your Own Spreadsheet

Wisesheets pulls live dividend yield, payout ratio, 5 and 10 year DGR, and consecutive years of increases directly into Excel and Google Sheets with one formula. Build your own dividend tracker with the actual data behind this calculator.

Get Free Trial