


SPY has returned 15.4% per year over the past 10 years on a total-return basis with dividends reinvested, turning $10,000 into about $41,718. Its low 0.09% fee is deducted from that return. Its price-only return was lower, near 13.6%, because reinvested distributions do much of the compounding.
- Total returns assume dividends reinvested at each ex-date
- net of the 0.09% expense ratio
- Total holdings
- 504
- Top 10 weight
- 38.5%
- Sectors
- 11
- Largest position
- 8.07%
- Median mkt cap
- $937B
Growth of $10,000
If you had invested $10,000 and reinvested every dividend
Performance & returns
annualized for periods over 1 year
| Period | Price return | Total return | vs S&P 500 |
|---|---|---|---|
| YTD | +11.7% | +12.3% | +0.00% |
| 1 year | +15.0% | +16.3% | +0.00% |
| 3 year | +19.7% | +21.1% | +0.00% |
| 5 year | +11.9% | +13.4% | +0.00% |
| 10 year | +13.6% | +15.4% | +0.00% |
| Since inception | +8.9% | +10.8% | — |
Risk & volatility
10-year
- Max drawdownpeak-to-trough decline-33.7%
- Sharpe ratiovs 3.5% risk-free0.66
- Best year2019+31.2%
- Worst year2022-18.2%
Calendar-year total returns
dividends reinvested
SPY return calculator
Total return, reinvestedUses SPY's 15.4% historical annual total return. Past performance does not predict future results.
Full calculator with monthly contributions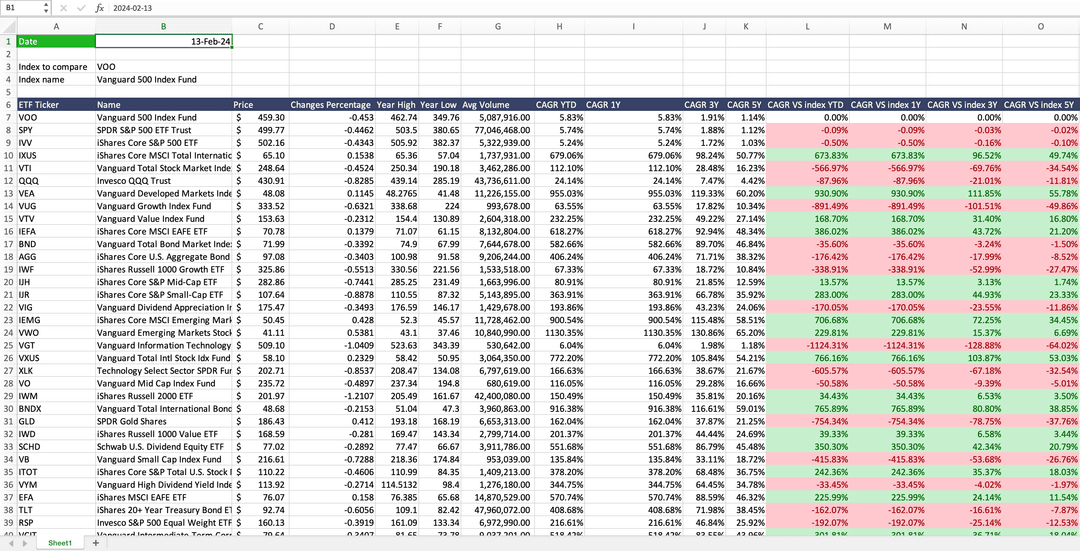
Compare and track all ETFs in your sheet
Type =WISE("SPY","dividend yield","ttm") or =WISEFUNDS("SPY","expense ratio") in Excel or Google Sheets and the fund's data lands in your sheet, ready to be refreshed when you want.
Get The Add-in - FreeSPY frequently asked questions
SPY has returned about 15.4% per year over the past 10 years on a total-return basis with dividends reinvested. Since its 1993 inception it has returned roughly 10.8% a year. That figure is after the fund's 0.09% expense ratio, which is deducted from returns.
$10,000 invested in SPY 10 years ago would be worth about $41,718 today with dividends reinvested. Your exact result depends on the entry date, but the growth-of-$10,000 chart above shows the full path including drawdowns along the way.
SPY is the S&P 500 fund used as the benchmark on this page, so it tracks the index rather than trying to beat it. Its total return is the index return less the fund's 0.09% expense ratio and any tracking difference.
Price return counts only the change in share price; total return adds reinvested dividends. Over 10 years SPY's total return of about 15.4% annually is higher than its price-only return of roughly 13.6%, because reinvested distributions compound over time. Total return is the number that reflects what an investor actually earned, which is why it is shown as the headline figure on this page.