


The YieldMax MSTR Option Income Strategy ETF, known by its ticker MSTY, operates as an actively managed investment vehicle that trades on an exchange. Its primary objective is to produce regular weekly income through the systematic sale of call options or call spreads, with MSTR as the underlying asset. This strategy is specifically engineered to capture the premiums generated from these option sales, while also allowing investors to retain some exposure to potential upward movements in MSTR's share price.
Holdings and distributions sourced from YieldMax fund filingsupdated daily
Top holdings
View holdingsDividends
Full historyIs MSTY a good investment?
MSTY is a dividend ETF that provides exposure to established, dividend-paying companies. It holds approximately 26 securities and charges an annual expense ratio of 1.03%. Its beta of 2.21 measures how it has moved more than the broad market historically.
Strengths
- Yields 165.43%
Trade-offs
- Expense ratio of 1.03% costs $103 a year on every $10,000 invested
- One-year total return of -50.6% has trailed the S&P 500's +16.3%
- Concentrated portfolio of just 26 holdings, the largest 19.9%
- Higher volatility (beta 2.21) than the broad market
This is an analysis of the fund's characteristics, not a recommendation. Whether MSTY suits any individual depends on their goals, time horizon, risk tolerance and the rest of their portfolio.
Performance & returns
Full performance| Price return | YTD | 1 year | 3 year | 5 year | 10 year | Since incept. |
|---|---|---|---|---|---|---|
| MSTY | -44.3% | -79.7% | -84.4% | -84.4% | -84.4% | -84.4% |
| S&P 500 (SPY) | +11.7% | +15.0% | +71.7% | +75.5% | +256.9% | — |
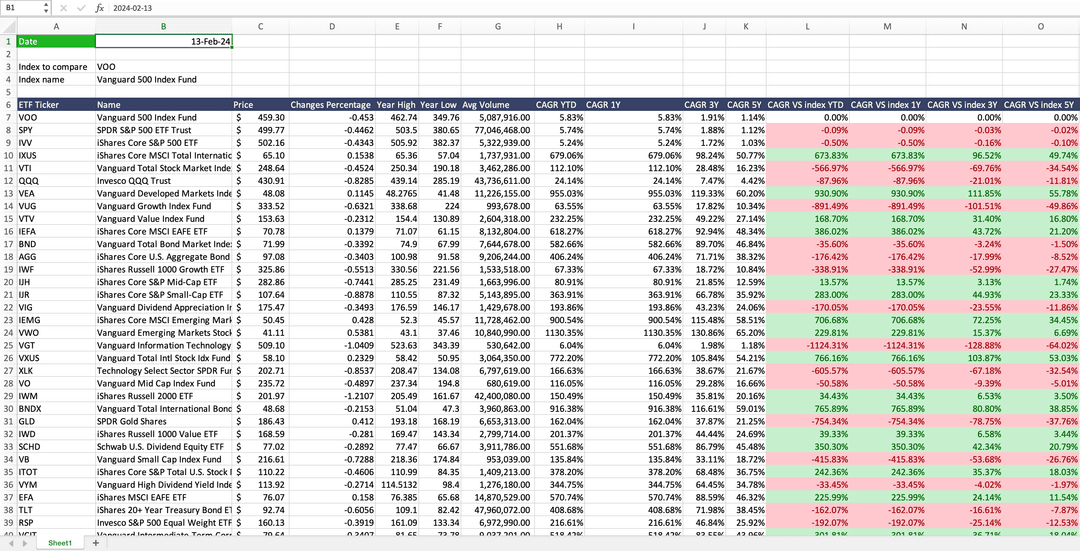
Compare and track all ETFs in your sheet
Type =WISE("MSTY","dividend yield","ttm") or =WISEFUNDS("MSTY","expense ratio") in Excel or Google Sheets and the fund's data lands in your sheet, ready to be refreshed when you want.
Get The Add-in - FreeMSTY frequently asked questions
MSTY charges a 1.03% expense ratio and yields 165.43%. Whether it suits any individual depends on their goals, time horizon, risk tolerance and the rest of their portfolio, and this is not investment advice.
MSTY has an expense ratio of 1.03%, which works out to $103.00 per year on a $10,000 investment. That is at the higher end for an ETF, so the fee takes a larger share of the return.
MSTY pays dividends weekly, every trading week. See the full payment history and ex-dates.
MSTY holds 26 positions. The largest position is Cash & Other at 19.9% of the fund. See the full holdings page for the largest positions and sector weights.