


Vanguard Specialized Funds - Vanguard Dividend Appreciation ETF is an exchange traded fund launched and managed by The Vanguard Group, Inc. It invests in public equity markets of the United States. The fund invests in stocks of companies operating across diversified sectors. The fund invests in growth and value stocks of companies across diversified market capitalization. It invests in dividend paying stocks of companies. It seeks to track the performance of the S&P U.S. Dividend Growers Index, by using full replication technique. Vanguard Specialized Funds - Vanguard Dividend Appreciation ETF was formed on April 21, 2006 and is domiciled in the United States.
Holdings and distributions sourced from Vanguard fund filingsupdated daily
Top holdings
View holdings


Dividends
Full historyIs VIG a good investment?
VIG is an equity ETF that provides exposure to technology companies. It holds approximately 338 securities and charges an annual expense ratio of 0.04%. Technology makes up 26% of the portfolio, so performance leans heavily on that sector.
Strengths
- Low 0.04% expense ratio, equal to approximately $4.00 a year on every $10,000 invested
- Dividend has grown ~7% annually over the past decade
- Spread across 338 holdings, the largest just 4.7% of the fund
- Lower volatility (beta 0.82) than the broad market
Trade-offs
- One-year total return of +11.7% has trailed the S&P 500's +16.3%
- Five-year total return of +66.3% has trailed the S&P 500's +87.2%
- Technology is 26% of the fund, so sector shifts move it
- Yield of 1.51% is below dedicated income funds
This is an analysis of the fund's characteristics, not a recommendation. Whether VIG suits any individual depends on their goals, time horizon, risk tolerance and the rest of their portfolio.
Performance & returns
Full performance| Price return | YTD | 1 year | 3 year | 5 year | 10 year | Since incept. |
|---|---|---|---|---|---|---|
| VIG | +7.8% | +9.9% | +46.7% | +52.3% | +185.9% | +372.7% |
| S&P 500 (SPY) | +11.7% | +15.0% | +71.7% | +75.5% | +256.9% | — |
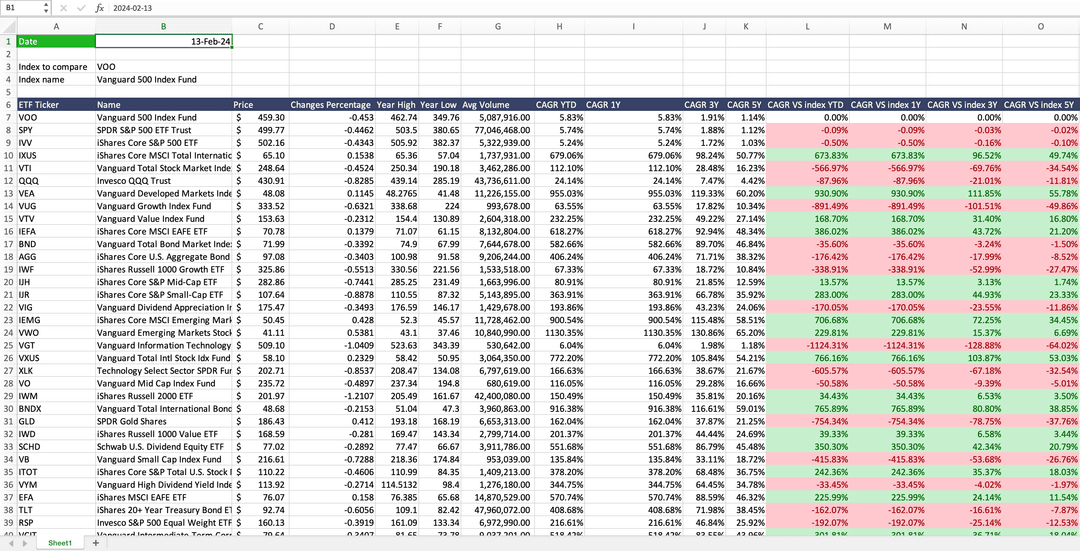
Compare and track all ETFs in your sheet
Type =WISE("VIG","dividend yield","ttm") or =WISEFUNDS("VIG","expense ratio") in Excel or Google Sheets and the fund's data lands in your sheet, ready to be refreshed when you want.
Get The Add-in - FreeVIG frequently asked questions
VIG charges a 0.04% expense ratio, yields 1.51% and has grown its distribution roughly 7% a year over the past decade. Whether it suits any individual depends on their goals, time horizon, risk tolerance and the rest of their portfolio, and this is not investment advice.
VIG has an expense ratio of 0.04%, which works out to $4.00 per year on a $10,000 investment. That is at the low end for an ETF, so more of the return stays with the investor.
VIG pays dividends quarterly, four times a year. Its distribution has grown roughly 7% per year over the past decade. See the full payment history and ex-dates.
VIG holds 338 positions. Its largest sectors are technology, financial services, healthcare and industrials. The largest position is Microsoft at 4.7% of the fund. See the full holdings page for the largest positions and sector weights.