


The JPMorgan Equity Premium Income ETF aims to capture the majority of the performance delivered by its primary benchmark, the S&P 500 Total Return Index. It seeks to accomplish this while simultaneously reducing investor risk through lower volatility and providing supplemental income. Typically, the fund allocates at least 80% of its assets to equity holdings. Additionally, it has the flexibility to invest in stocks not included in the S&P 500 Index.
Holdings and distributions sourced from J.P. Morgan fund filingsupdated daily
Top holdings
View holdings


Dividends
Full historyIs JEPI a good investment?
JEPI is a dividend ETF that provides exposure to established, dividend-paying companies. It holds approximately 135 securities and charges an annual expense ratio of 0.35%. Its beta of 0.43 measures how it has moved less than the broad market historically.
Strengths
- Yields 8.15%
- Spread across 135 holdings, the largest just 2.0% of the fund
- Lower volatility (beta 0.43) than the broad market
Trade-offs
- One-year total return of +7.0% has trailed the S&P 500's +16.3%
- Five-year total return of +43.2% has trailed the S&P 500's +87.2%
This is an analysis of the fund's characteristics, not a recommendation. Whether JEPI suits any individual depends on their goals, time horizon, risk tolerance and the rest of their portfolio.
Performance & returns
Full performance| Price return | YTD | 1 year | 3 year | 5 year | 10 year | Since incept. |
|---|---|---|---|---|---|---|
| JEPI | -1.7% | -1.2% | +1.7% | -7.0% | +12.6% | +12.6% |
| S&P 500 (SPY) | +11.7% | +15.0% | +71.7% | +75.5% | +256.9% | — |
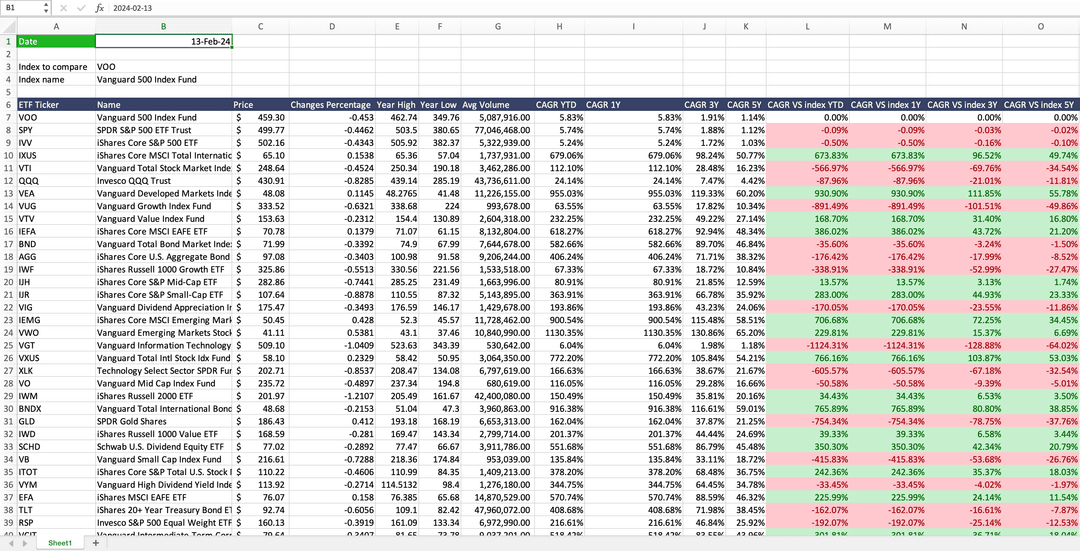
Compare and track all ETFs in your sheet
Type =WISE("JEPI","dividend yield","ttm") or =WISEFUNDS("JEPI","expense ratio") in Excel or Google Sheets and the fund's data lands in your sheet, ready to be refreshed when you want.
Get The Add-in - FreeJEPI frequently asked questions
JEPI charges a 0.35% expense ratio and yields 8.15%. Whether it suits any individual depends on their goals, time horizon, risk tolerance and the rest of their portfolio, and this is not investment advice.
JEPI has an expense ratio of 0.35%, which works out to $35.00 per year on a $10,000 investment. Fees vary widely by fund type, so it is worth comparing against funds running the same strategy.
JEPI pays dividends monthly, twelve times a year. See the full payment history and ex-dates.
JEPI holds 135 positions. Its largest sectors are technology, healthcare, industrials and consumer cyclical. The largest position is Meta Platforms at 2.0% of the fund. See the full holdings page for the largest positions and sector weights.