


BNDX pays a monthly dividend, currently $0.1206 per share, for a trailing yield of 4.65%. The amount is variable rather than fixed — over the past twelve months it has ranged from $0.0998 to $0.9686 per share. BNDX has made 159 declared distributions since July 2013.
Holdings and distributions sourced from Vanguard fund filingsupdated daily
BNDX sets a new ex-dividend date every month. To receive a distribution you must own shares before the market opens on that ex-dividend date. BNDX has not declared its next distribution yet, so the figures above are the most recent one on record.
BNDX dividend history
Every monthly distribution with its ex-date, record date, payment date and amount. Figures come from the fund's own declarations, so nothing here is estimated.
| Ex-dividend date | Record date | Payment date | Amount | Change |
|---|---|---|---|---|
| Sep 1, 2026 | Sep 1, 2026 | Sep 3, 2026 | $0.1206 | +1.8% |
| Aug 3, 2026 | Aug 3, 2026 | Aug 5, 2026 | $0.1185 | +6.6% |
| Jul 1, 2026 | Jul 1, 2026 | Jul 6, 2026 | $0.1112 | -2.5% |
| Jun 1, 2026 | Jun 1, 2026 | Jun 3, 2026 | $0.1141 | +1.3% |
| May 1, 2026 | May 1, 2026 | May 5, 2026 | $0.1126 | +0.8% |
| Apr 1, 2026 | Apr 1, 2026 | Apr 6, 2026 | $0.1117 | +11.9% |
| Mar 2, 2026 | Mar 2, 2026 | Mar 4, 2026 | $0.0998 | -11.2% |
| Feb 2, 2026 | Feb 2, 2026 | Feb 4, 2026 | $0.1124 | -88.4% |
| Dec 18, 2025 | Dec 18, 2025 | Dec 22, 2025 | $0.9686 | +827.8% |
| Dec 1, 2025 | Dec 1, 2025 | Dec 3, 2025 | $0.1044 | -4.0% |
Is BNDX's dividend sustainable?
Variable incomeBNDX's payout is real cash, but it is variable: over the past twelve months the monthly distribution has swung 871% between its smallest and largest payment, so it should not be treated as a fixed amount. The annual distribution has grown about 26.8% a year over the past five years. Its NAV is down 15.3% over ten years, so some of the income has come out of principal. This is an analysis of the fund's payment record, not a recommendation or a forecast of future distributions.
NAV trend (does the payout erode capital?)
10-year rangeBNDX's NAV is down 15.3% over the period, so part of the distribution has come out of principal. This is the key number to watch for any income ETF.
BNDX monthly income calculator
Live BNDX dataBased on the current $0.12 monthly rate. Actual distributions vary month to month.
Full calculator with DRIP & reinvestment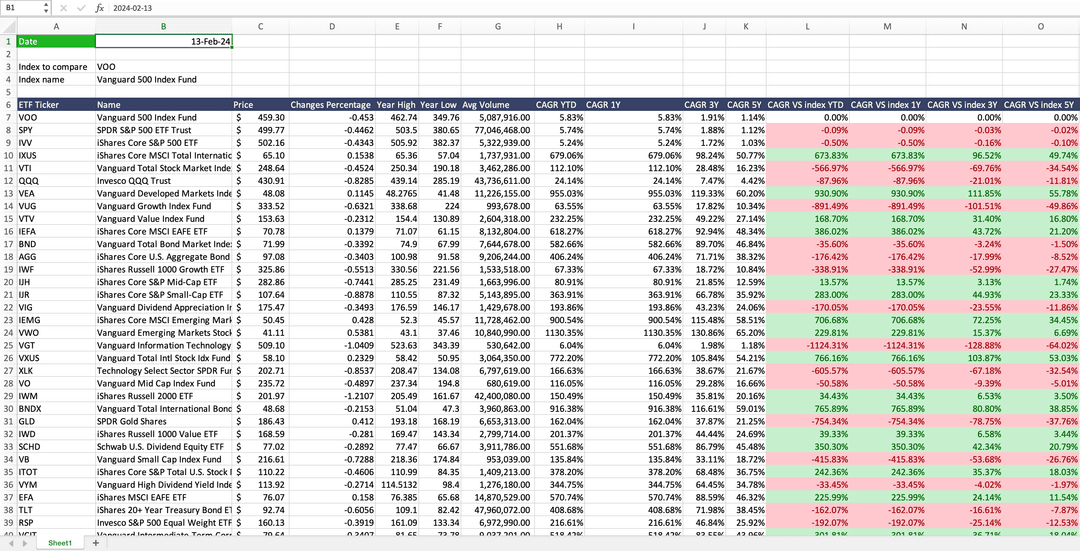
Compare and track all ETFs in your sheet
Type =WISE("BNDX","dividend yield","ttm") or =WISEFUNDS("BNDX","expense ratio") in Excel or Google Sheets and the fund's data lands in your sheet, ready to be refreshed when you want.
Get The Add-in - FreeBNDX frequently asked questions
BNDX pays dividends monthly, twelve times a year. The amount varies from payment to payment rather than being fixed. Its declared history runs back to July 2013. See the BNDX overview for expense ratio, holdings and returns.
Yes. BNDX declares a distribution every month, with the record date a few days after the ex-dividend date and payment shortly after that. The exact dates for each month are in the history table above.
BNDX's trailing-twelve-month dividend yield is about 4.65%, based on the last twelve months of distributions and the current price of $47.05. Annualising the most recent payment instead gives a forward yield of 3.08%. These figures move as distributions and price change.
BNDX's distribution is variable — it has ranged from $0.0998 to $0.9686 per share over the past twelve months, so it should not be treated as a fixed payout. The annual total has grown roughly 26.8% a year over the past five years. Past distributions are not a guarantee of future ones, and this is not investment advice.