


To pursue its goal, the fund normally invests at least 80% of its net assets, plus any borrowings for investment purposes, in U.S. dollar-denominated fixed-income securities that provide income exempt from federal personal income tax (municipal bonds). It may invest up to 20% of its assets in taxable fixed-income securities, including taxable municipal bonds and non-U.S. dollar-denominated foreign debt securities such as Brady bonds and sovereign debt obligations.
Holdings and distributions sourced from BNY Mellon fund filingsupdated daily
Top holdings
View holdingsDividends
Full historyIs BMOP a good investment?
BMOP is a bond ETF that provides exposure to a portfolio of fixed-income securities. It holds approximately 673 securities and charges an annual expense ratio of 0.54%. Its beta of 1.03 measures how it has moved more than the broad market historically.
Strengths
- Spread across 673 holdings, the largest just 0.9% of the fund
Trade-offs
- Expense ratio of 0.54% costs $54 a year on every $10,000 invested
- Bond funds carry interest-rate risk: prices fall when rates rise
This is an analysis of the fund's characteristics, not a recommendation. Whether BMOP suits any individual depends on their goals, time horizon, risk tolerance and the rest of their portfolio.
Performance & returns
Full performance| Price return | YTD | 1 year | 3 year | 5 year | 10 year | Since incept. |
|---|---|---|---|---|---|---|
| BMOP | -3.7% | -3.7% | -3.7% | -3.7% | -3.7% | -3.7% |
| S&P 500 (SPY) | +11.7% | +15.0% | +71.7% | +75.5% | +256.8% | — |
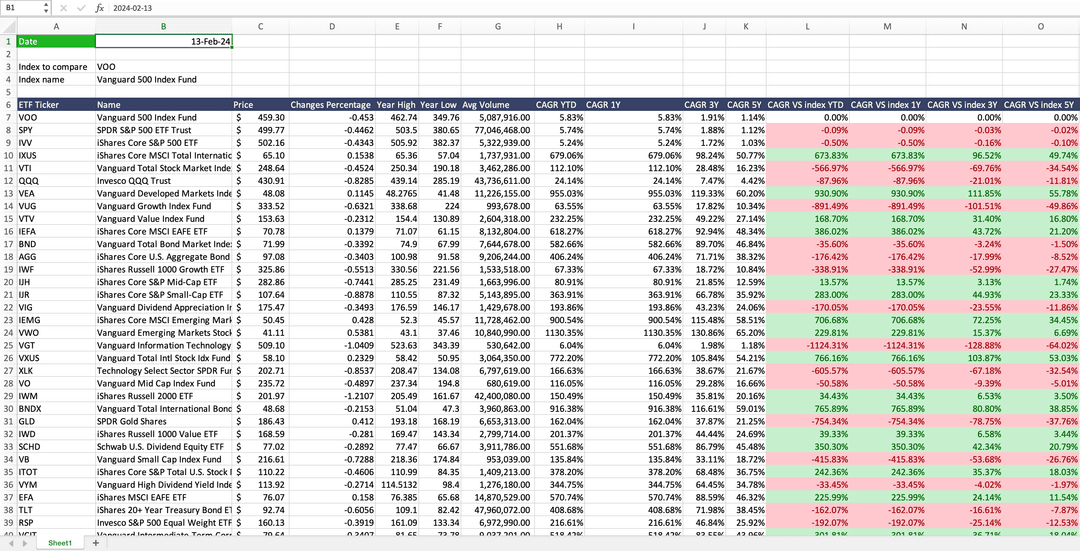
Compare and track all ETFs in your sheet
Type =WISE("BMOP","dividend yield","ttm") or =WISEFUNDS("BMOP","expense ratio") in Excel or Google Sheets and the fund's data lands in your sheet, ready to be refreshed when you want.
Get The Add-in - FreeBMOP frequently asked questions
BMOP charges a 0.54% expense ratio and yields 2.26%. Whether it suits any individual depends on their goals, time horizon, risk tolerance and the rest of their portfolio, and this is not investment advice.
BMOP has an expense ratio of 0.54%, which works out to $54.00 per year on a $10,000 investment. That is at the higher end for an ETF, so the fee takes a larger share of the return.
BMOP pays dividends quarterly, four times a year. See the full payment history and ex-dates.
BMOP holds 673 positions. The largest position is Intermountain Pwr Agy 5 7/1/2042 at 0.9% of the fund. See the full holdings page for the largest positions and sector weights.