
Mediobanca Banca di Credito Finanziario S.p.A. - Dividend History
MDIBY
Price:
$32.5
Market Cap:
$22.97B
Mediobanca Banca di Credito Finanziario S.p.A., together with its subsidiaries, provides various banking products and services in Italy, Other European countries, the United States, Asia, and internationally. It operates through Wealth Management, Consumer Finance, Corporate and Investment Banking, Insurance - Principal Investing, and Holding Functions segments. The Wealth Management segment offers portfolio management, asset management, and management services to private banking and premier customers. Its Consumer Finance segment provides a range of consumer credit products, including personal and special-purpose loans, salary-or pension-backed finances, and credit cards, as well as Pagolig...[Read more]
Industry
Banks - Regional
IPO Date
2018-02-28
Stock Exchange
OTC
Ticker
MDIBY
PE Ratio
[18.04]
ROE
[10.73%]
Current Ratio
[0]
Dividend Yield
[4.28%]
Enterprise Value
[63.19B]
Dividend History
MDIBY Dividend History Overview
Dividends are a key part of long-term returns for investors, and Mediobanca Banca di Credito Finanziario S.p.A. (MDIBY) has a track record worth reviewing. Looking at dividend history for MDIBY gives you an idea of how consistent the dividends have been and what you might expect in the future.
Ex-Dividend Date
2026-04-21
Dividend Yield
4.28%
Annual Dividend
$0.74
P/E Ratio
18.04
Payout Ratio
0
Dividend per Share
$1.22
EPS
1.80
| Ex-Date/EFF Date | Dividend Amount | Adjusted Dividend | Payment Date | Declaration Date |
|---|---|---|---|---|
| 2026-04-21 | $0.73811 | $0.73811 | 2026-05-07 | 2026-04-02 |
| 2025-11-25 | $0.6818 | $0.6818 | 2025-12-11 | 2025-10-28 |
| 2025-05-22 | $0.63358 | $0.63358 | 2025-06-05 | 2025-05-12 |
| 2024-11-19 | $0.58834 | $0.58834 | 2024-12-05 | 2024-11-04 |
| 2024-05-23 | $0.55182 | $0.55182 | 2024-06-07 | 2024-05-14 |
| 2023-11-20 | $0.92055 | $0.92055 | 2023-12-07 | 2023-11-21 |
| 2022-11-21 | $0.78503 | $0.78503 | 2022-12-08 | 2022-10-26 |
| 2021-11-22 | $0.74659 | $0.74659 | 2021-12-09 | 2021-10-25 |
| 2019-11-18 | $0.52024 | $0.52024 | 2019-12-09 | 2019-10-09 |
| 2018-11-19 | $0.53228 | $0.53228 | 2018-12-06 | 2018-10-30 |
| 2017-11-20 | $0.43434 | $0.43434 | 2017-12-07 | 2017-10-26 |
Mediobanca Banca di Credito Finanziario S.p.A. (MDIBY) Dividend History Chart
The table below shows Mediobanca Banca di Credito Finanziario S.p.A. (MDIBY) dividend history over the years, including the amount per share, the payout date, and any adjustments for stock splits.
Mediobanca Banca di Credito Finanziario S.p.A. (MDIBY) Dividend Growth
Mediobanca Banca di Credito Finanziario S.p.A. (MDIBY) dividend history also allows you to track its dividend growth over time. This gives you insight into how the company’s earnings and payout ratios have evolved. Tracking this growth can help you gauge the stock's potential for future income.
Other Popular Dividend Stocks
Check out the dividend history of other popular stocks:
Track & Identify Dividend Stocks
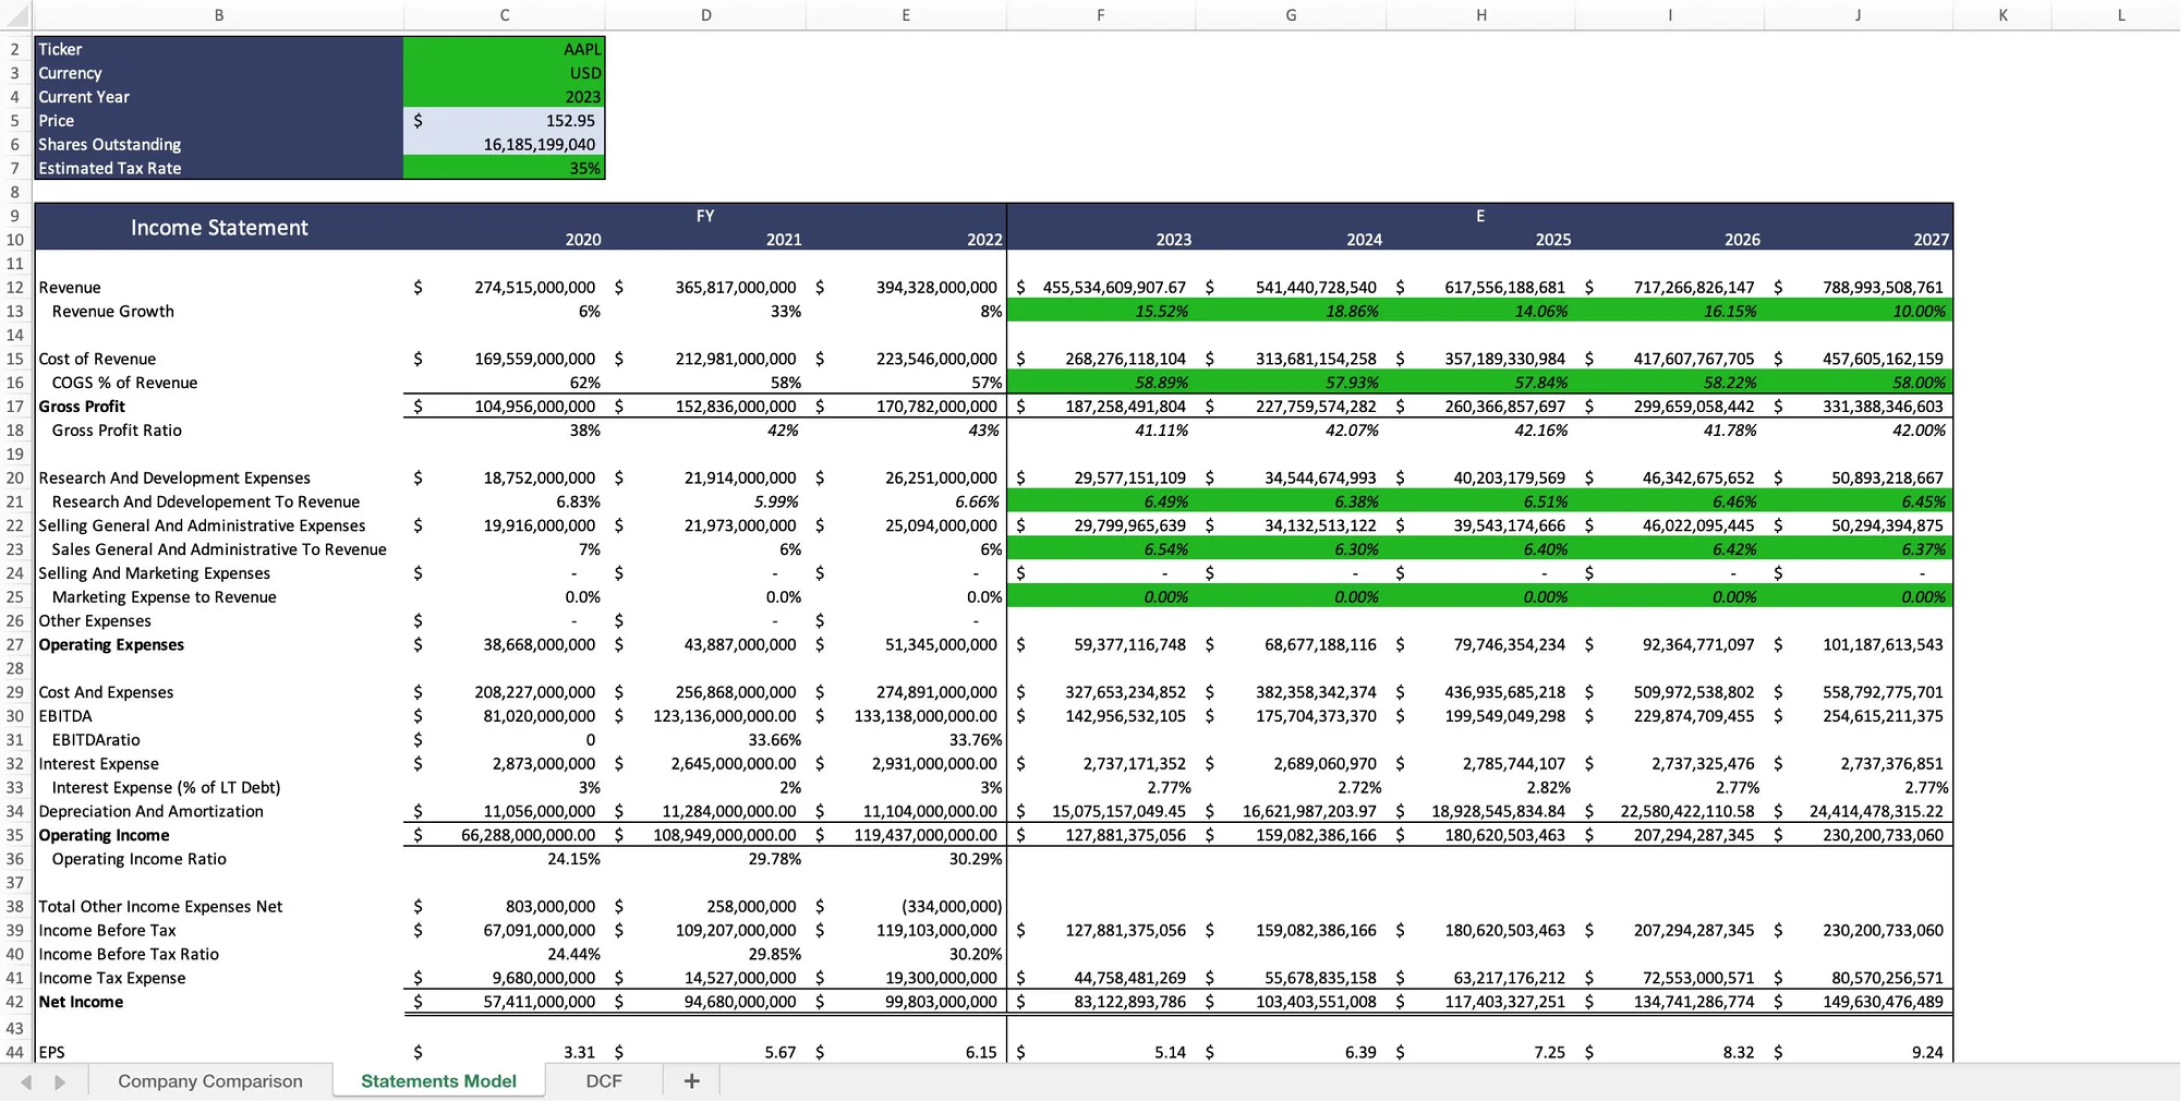
Tracking and finding valuable dividend stocks to invest in is difficult. For this, you can use Wisesheets, which allows you to pull all necessary dividend, financial, and price data to track your dividend investments in one place exactly how you want, using the power of spreadsheets.
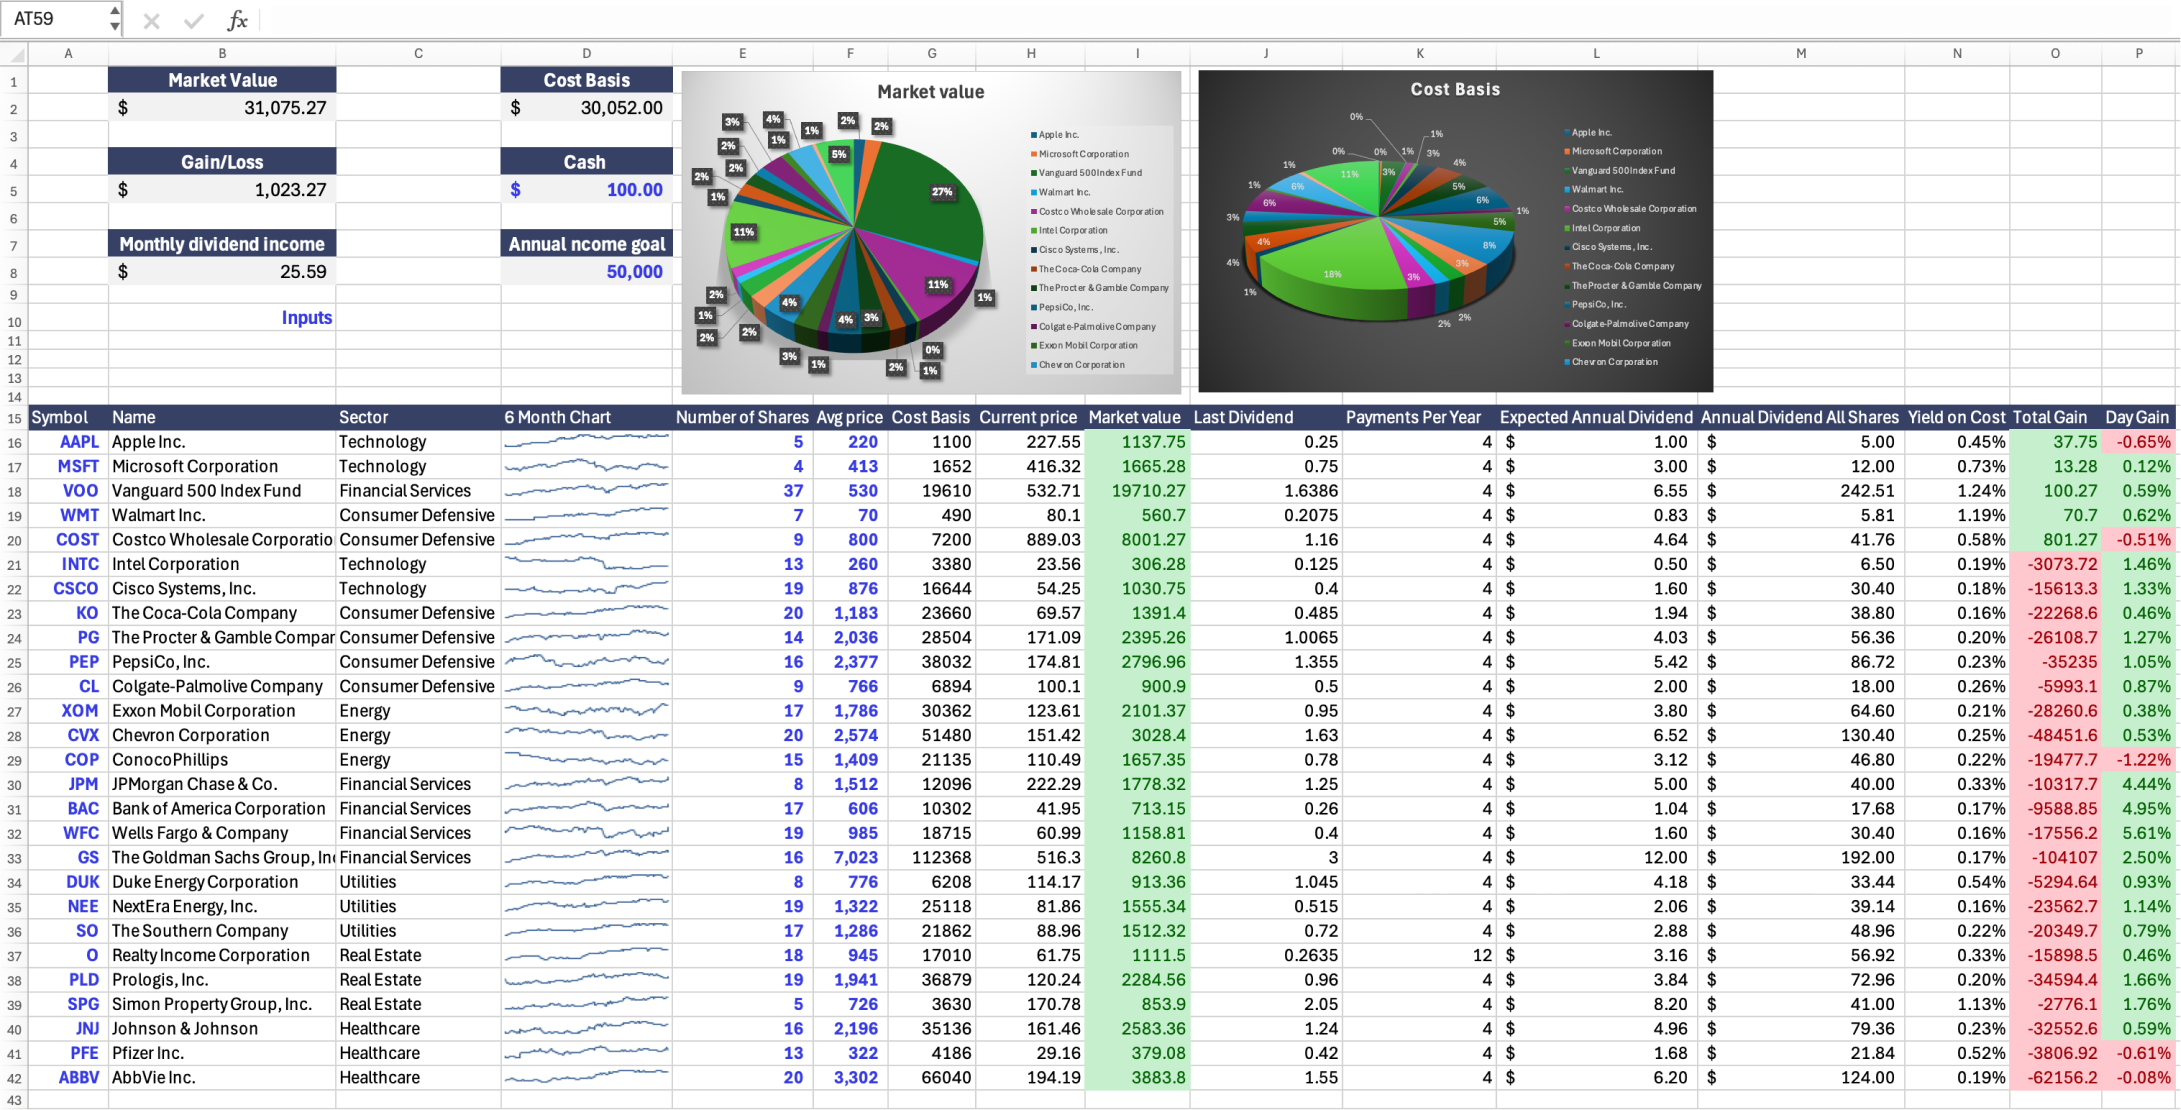
You can build any custom analysis dashboards, screeners and trackers with no code and analyze companies like Mediobanca Banca di Credito Finanziario S.p.A. (MDIBY) without the pain and hassle of copy pasting data.
Frequently asked questions❓
What is dividend history?
How do I check past dividend history?
What does the ex-dividend date mean?
What is MDIBY’s dividend yield?
What is the difference between regular and special dividends?
Has MDIBY increased its dividends over time?
Why might dividend history data be delayed?
How often does MDIBY pay dividends?
What factors impact MDIBY's dividend payments?
Can dividends change over time?
What is MDIBY’s next dividend date?