
Baillie Gifford US Growth Trust PLC ROE
Profitability, historical returns, and peer comparisons.
The ROE as of November 2026 (TTM) for Baillie Gifford US Growth Trust PLC (BLGFF) is 25.27%
According to Baillie Gifford US Growth Trust PLC’s latest financial reports and current stock price. The company's current ROE is 25.27%. This represents a change of 142.92% compared to the average of 10.40% of the last 4 quarters.
Baillie Gifford US Growth Trust PLC (BLGFF) Historical ROE (quarterly & annually)
How has BLGFF ROE performed in the past?
The mean historical ROE of Baillie Gifford US Growth Trust PLC over the last ten years is 9.60%. The current 25.27% ROE has changed 163.25% with respect to the historical average. Over the past ten years (40 quarters), BLGFF's ROE was at its highest in in the November 2020 quarter at 33.43%. The ROE was at its lowest in in the May 2022 quarter at -81.95%.
Average
9.60%
Median
17.60%
Minimum
-55.28%
Maximum
32.99%
Baillie Gifford US Growth Trust PLC (BLGFF) ROE by Quarter and Year
Discovering the peaks and valleys of Baillie Gifford US Growth Trust PLC ROE, unveiling quarterly and yearly fluctuations to gain insights into the company’s financial performance and market dynamics, offering valuable data for investors and analysts alike.
Maximum Annual Increase = 70.62%
Maximum Annual ROE = 32.99%
Minimum Annual Increase = -609.20%
Minimum Annual ROE = -55.28%
| Year | ROE | Change |
|---|---|---|
| 2026 | 23.64% | 29.89% |
| 2025 | 18.20% | 30.38% |
| 2024 | 13.96% | -609.20% |
| 2023 | -2.74% | -95.04% |
| 2022 | -55.28% | -267.56% |
| 2021 | 32.99% | 13.68% |
| 2020 | 29.02% | 70.62% |
Baillie Gifford US Growth Trust PLC (BLGFF) Average ROE
How has BLGFF ROE performed in the past?
The current ROE of Baillie Gifford US Growth Trust PLC (BLGFF) is less than than its 3-year, greater than its 5-year, and less than than its 10-year historical averages
3-year avg
18.60%
5-year avg
-0.44%
10-year avg
9.60%
Baillie Gifford US Growth Trust PLC (BLGFF) ROE vs. Peers
How is BLGFF’s ROE compared to its peers?
Baillie Gifford US Growth Trust PLC’s ROE is less than AVI Global Trust plc (4.87%), less than BlackRock World Mining Trust plc (44.05%), less than The Edinburgh Investment Trust plc (7.03%), less than The European Smaller Companies Trust PLC (13.22%), less than Henderson European Trust Plc (0%), less than Witan Investment Trust plc (11.70%), greater than JPMorgan Indian Investment Trust plc (-22.45%), less than JPMorgan European Discovery Trust plc (19.15%), less than The Monks Investment Trust PLC (24.22%), less than Templeton Emerging Markets Investment Trust plc (31.30%),
| Company | ROE | Market cap |
|---|---|---|
| 4.87% | $1.29B | |
| 44.05% | $1.31B | |
| 7.03% | $1.44B | |
| 13.22% | $1.49B | |
| 0% | $1.63B | |
| 11.70% | $1.80B | |
| -22.45% | $694.72M | |
| 19.15% | $667.15M | |
| 24.22% | $3.71B | |
| 31.30% | $3.84B |
Build a custom stock screener for Baillie Gifford US Growth Trust PLC (BLGFF) and other stocks
One of the best ways to find valuable stocks to invest in is to build a custom made screener in your Excel or Google Sheets spreadsheet. This allows you to compare thousands of companies like Baillie Gifford US Growth Trust PLC using the financials and key metrics that matter to you in a single view.
The easiest way to set this up is to use the Wisesheets add-on and set your spreadsheet like this:
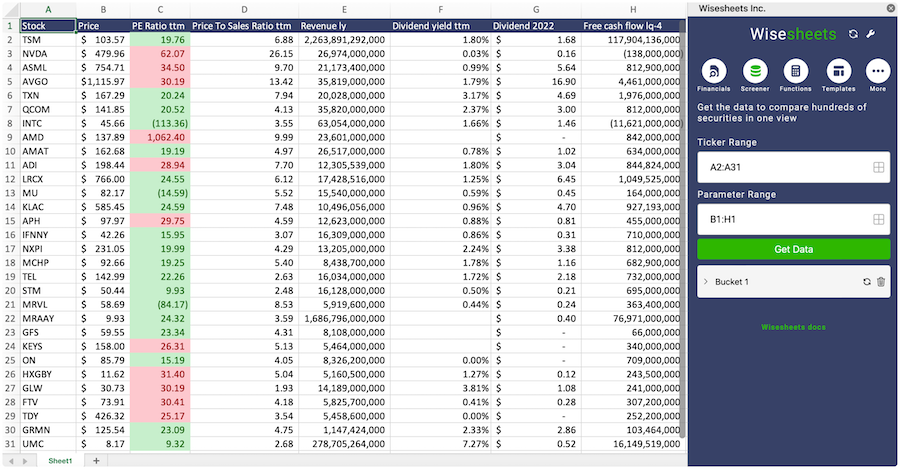
Covering all these metrics from financial, data, dividend data, key metrics and more you can get all the data you want for over 50+ exchanges worldwide.
Get your free trial here.
Baillie Gifford US Growth Trust PLC (BLGFF) and other stocks custom spreadsheet templates
The easiest way to analyze a company like Baillie Gifford US Growth Trust PLC or any others is to create a spreadsheet model that automatically retrieves all of the stock data you need.
Using Wisesheets you can set up a spreadsheet model like this with simple spreadsheet formulas. If you change the ticker you can get all of the data automatically updated for you.
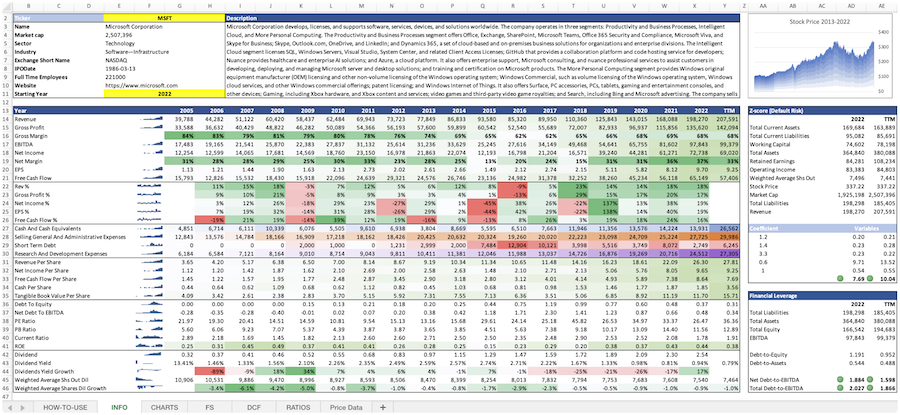
Whether you need live data, historical price data, financials, dividend data, key metrics, analyst estimates, or anything else...Wisesheets has you covered.
Frequently asked questions❓
What is the ROE?
How can you use the ROE?
What is Baillie Gifford US Growth Trust PLC's ROE?
How is the ROE calculated for Baillie Gifford US Growth Trust PLC (BLGFF)?
What is the highest ROE for Baillie Gifford US Growth Trust PLC (BLGFF)?
What is the 3-year average ROE for Baillie Gifford US Growth Trust PLC (BLGFF)?
What is the 5-year average ROE for Baillie Gifford US Growth Trust PLC (BLGFF)?
How does the current ROE for Baillie Gifford US Growth Trust PLC (BLGFF) compare to its historical average?