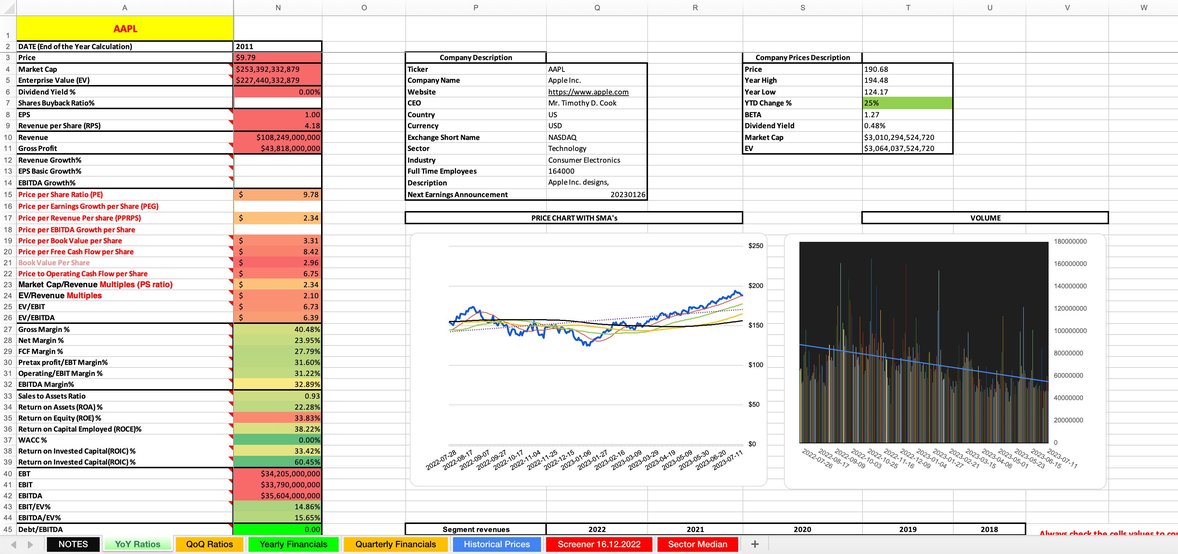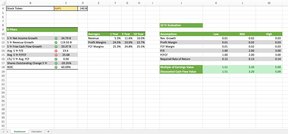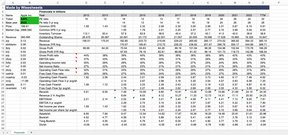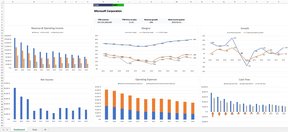
Unleash the power of data-driven insights tailored for stock market enthusiasts. Our template offers YoY ratios, QoQ metrics, dynamic charts, and more, ensuring a holistic view of your chosen stocks.
The stock market is a maze of numbers and patterns. With the Complete Quantitative Analysis Template for Stocks, you're equipped with a robust set of tools to decode these patterns. From understanding segment revenues to analyzing sector trends, this template is your gateway to making informed investment decisions.
Why Our Stock Analysis Template is Unparalleled
- Detailed Ratios: Delve into Year-on-Year (YoY) and Quarter-on-Quarter (QoQ) metrics to track performance nuances.
- Intuitive Charts: Visualize stock trajectories with interactive and insightful charts.
- Real-time Price Data: Stay updated with live stock prices, ensuring timely investment actions.
- Segment Revenues Breakdown: Understand the diverse revenue streams of companies.
- Sector Analysis: Gauge the broader industry landscape and identify sector standouts.
- Free Access: Quality financial insights shouldn’t break the bank. You can use this template for free; you just need to copy-paste the data from anywhere on the web or use the Wisesheets add-on to get the data automatically. (Get your free trial here).
Signature Features
- Historical Price Explorer: Trace stock price movements over the years for strategic analysis.
- Dynamic Ratio Calculators: Instantly compute YoY and QoQ ratios with guided inputs.
- Segment Revenue Insights: Dive deep into individual revenue contributors for comprehensive stock understanding.
- Sector Standouts: Identify top performers within sectors and understand industry dynamics.
- Customizable Timeframes: Tailor your analysis duration, from short-term outlooks to long-term forecasts.
Ideal for:
- Equity Research Analysts: Enhance stock evaluations with a full suite of analytical tools.
- Portfolio Managers: Strategically adjust portfolios based on in-depth stock insights.
- Stock Market Traders: Make timely trading decisions with real-time data and historical trends.
- Financial Students: Master the art of stock analysis with hands-on experience.
What Our Users Are Saying
"Analyzing stocks has never been this comprehensive. From YoY ratios to sector insights, this template is my stock market compass." - Darren J.
"The segment revenue breakdown provides clarity like no other tool. An absolute essential for serious stock analysts." - Rebecca T.
FAQs
Q: How often is the stock price data updated in the template?
A: Our template provides real-time stock price updates, ensuring you have the latest information at all times.
Q: Can I analyze multiple stocks simultaneously?
A: Absolutely! You can update the company ticker, and all of the data will update automatically, allowing for comparative insights.
Other powerful templates

Everything Money Stock Analyzer
This is "Everything money" 8 pillar + Stock analyzer tool.

Roaring Kitty Analysis Template
Analysis spreadsheet used by WSB investor Keith Gill.

Hypercharts Stock Graphs
Visualize stock fundamentals and key metrics in one single view.
