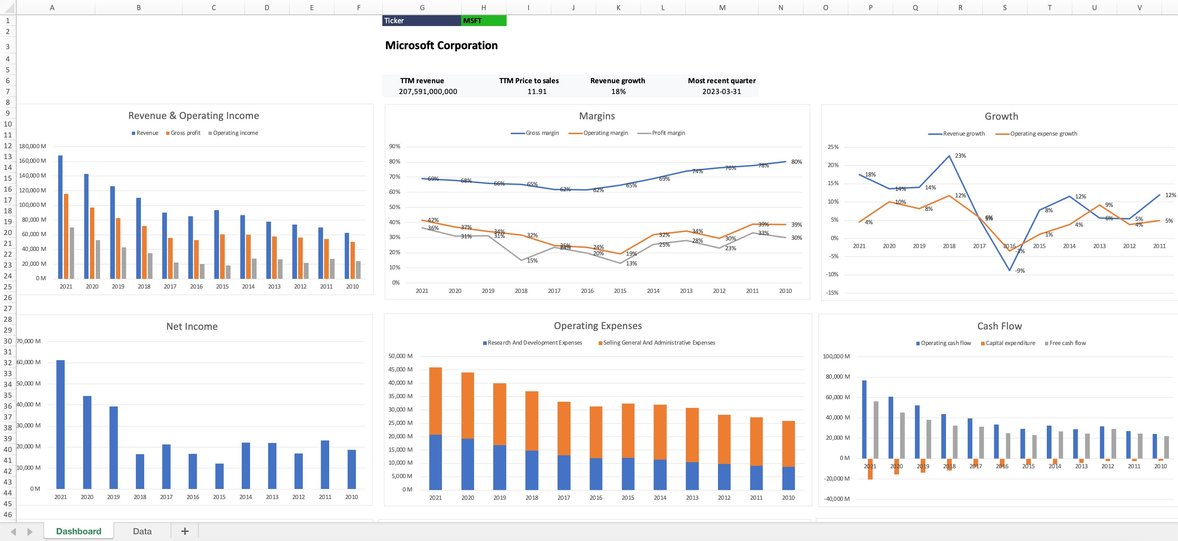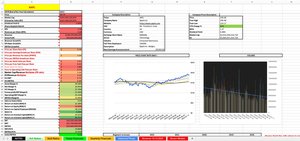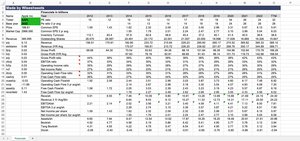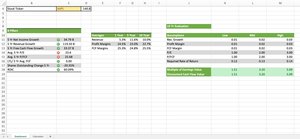
Transform raw financial data into vivid insights. The Hypercharts Stock Graphs Template unveils key company fundamentals and metrics in vibrant, interactive visualizations. Make informed decisions with a glance.
Introduction
In today's fast-paced stock market, clarity is paramount. The Hypercharts Stock Graphs Template offers a visual symphony of company data, allowing investors and analysts to instantly grasp the nuances of company performance. Dive into vibrant charts that bring to life earnings, revenues, user growth, and more.
Why Hypercharts Stock Graphs is Your Ultimate Analytical Ally
- Stunning Visuals: Experience company data like never before with our high-definition charts.
- Interactive Exploration: Hover, click, and drill down to uncover deeper insights.
- Key Fundamentals at a Glance: Quickly gauge a company's health with metrics like P/E ratios, debt levels, and cash flow.
- Real-time Updates: Synced with live financial data sources for up-to-date visualizations.
- Customizable Views: Choose which metrics matter most and tailor your visualization dashboard accordingly.
- Free Access: Quality financial insights shouldn’t break the bank. You can use this template for free; you just need to copy-paste the data from anywhere on the web or use the Wisesheets add-on to get the data automatically. (Get your free trial here).
Core Features
- Dynamic Revenue Graphs: Track sales and revenue trajectories across quarters and years.
- Earnings Visualizer: Understand profitability trends with vivid earnings charts.
- Historical Data Plots: See past performance to predict future trends.
Perfect For
- Stock Market Analysts: Enhance reports and presentations with compelling visuals.
- Investors: Quickly assess potential investments with data-driven graphics.
- Financial Educators: Teach financial concepts using intuitive visual aids.
User Praises
"Hypercharts Stock Graphs has revolutionized the way I view company data. It's intuitive, beautiful, and incredibly informative." - Kyle H.
"For visual learners like me, this template is a dream come true. I can now instantly gauge a company's performance trajectory." - Samantha P.
Other powerful templates

Complete Quantitative Analysis
Complete quantitative analysis with historical data, ratios etc...

Roaring Kitty Analysis Template
Analysis spreadsheet used by WSB investor Keith Gill.

Everything Money Stock Analyzer
This is "Everything money" 8 pillar + Stock analyzer tool.
