VOO vs VYM: Which Should You Buy?
Same fund company (Vanguard), same 0.03% fee.
Over the period we can measure, VOO has returned about 3.7% a year more and overlap about 35% by weight. Pick VOO for the tighter 505-holding portfolio; pick VYM to own 589 instead. Both cost 0.03% per year.
This is purely for informational purposes, not investment advice. Always consult a professional before making investment decisions.
VOO wins if...
You want the tighter portfolio: 505 holdings rather than 589, tracking the Standard & Poor's 500 Index.
VYM wins if...
You want maximum diversification: 589 holdings covering the broader market, tracking the FTSE High Dividend Yield Index.
VOO vs VYM, side by side
The numbers that actually differ are highlighted.
| Metric | VOOVanguard S&P 500 ETF | VYMVanguard High Dividend Yield ETF |
|---|---|---|
| Index tracked | Standard & Poor's 500 Index | FTSE High Dividend Yield Index |
| Number of holdings | 505 | 589 |
| Expense ratio | 0.03% | 0.04% |
| Dividend yield | 1.05% | 2.84% |
| AUM | $1.80T | $100.80B |
| Top 10 concentration | 37.8% | 25.8% |
| 10-yr total return | 15.4% | 11.7% |
| 5-yr total return | 13.5% | 12.4% |
| Beta (vs S&P 500) | 1.01 | 0.74 |
| Max drawdown (10yr) | -34.0% | -35.2% |
| Market-cap coverage | Large cap | Large cap |
| Inception | 2010 | 2006 |
VOO holds 505 positions tracking the Standard & Poor's 500 Index. VYM holds 589, a broader slice of the same market.
How much do VOO and VYM overlap?
The single most decision-relevant fact, and the one most comparisons skip.
- Shared
- 34.9%
- VYM-only
- 65.1%
~35% identical by weight
256 weighted positions appear in both funds, and by weight about 35% of the two portfolios is the same exposure. Where a stock sits in both, the shared share is whichever weight is smaller. That is the part of a dollar that behaves identically in either fund.
The difference is VYM's remaining 84 positions, which VOO does not hold at all. They are smaller by weight, which is why the two track each other closely and drift apart only at the margins.
Growth of $10,000: VOO vs VYM
Growth of $10,000
10 years
Which should you choose?
- You want concentrated exposure: 505 holdings, not 589
- You want to track the Standard & Poor's 500 Index
- You want the larger, more heavily traded fund ($1.8T)
- You want the wider net: 589 holdings against 505
- You want to track the FTSE High Dividend Yield Index
- You want the higher yield: 2.84% against 1.05%
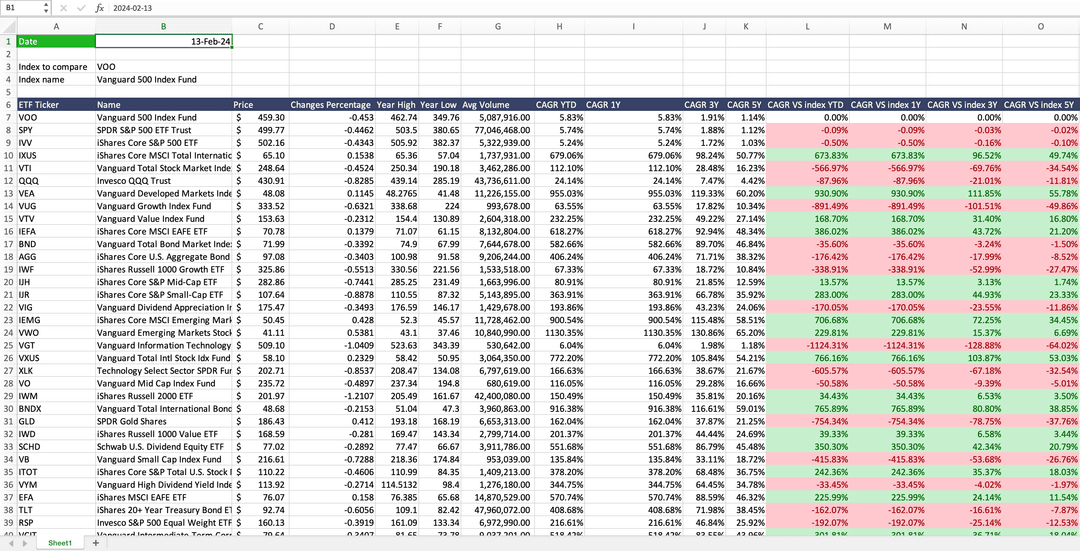
Compare and track all ETFs in your sheet
Type =WISE("VOO","dividend yield","ttm") or =WISEFUNDS("VOO","expense ratio") in Excel or Google Sheets and the fund's data lands in your sheet, ready to be refreshed when you want.
Get The Add-in - FreeVOO vs VYM frequently asked questions
VOO has the stronger record, by about 3.7% a year and they overlap roughly 35% by weight. Both charge 0.03%, so cost is not the deciding factor.
VOO holds 505 positions tracking the Standard & Poor's 500 Index. VYM holds 589, a broader slice of the same market.
Yes, by about 35% by weight. 256 weighted positions appear in both funds. Because the largest positions dominate both portfolios, the two behave similarly day to day.
Yes. At about 35% overlap the two hold substantially different positions, so holding both does broaden the exposure.