
I.E.S Holdings Ltd - Dividend History
IES.TA
Price:
$70970
Market Cap:
$4.13B
I.E.S Holdings Ltd operates principally within Israel's real estate investment sector. Its diverse activities encompass land leasing and rental, the development of various property assets, and major initiatives such as the creation of an airpark at the Ovda military base and a power generation facility in Palmachim Park. Furthermore, the firm supplies pre-fabricated concrete components to the construction industry. Established in 1987, the company was formerly known as I.E.S Saar Ltd. before adopting its current name, I.E.S Holdings Ltd., in February 2005. Its corporate headquarters are situated in Tel Aviv, Israel.
Industry
Real Estate - Services
IPO Date
2000-02-01
Stock Exchange
TLV
Ticker
IES.TA
PE Ratio
[26.43]
ROE
[10.97%]
Current Ratio
[2.15K]
Dividend Yield
[0%]
Enterprise Value
[3.81B]
Dividend History
IES.TA Dividend History Overview
Dividends are a key part of long-term returns for investors, and I.E.S Holdings Ltd (IES.TA) has a track record worth reviewing. Looking at dividend history for IES.TA gives you an idea of how consistent the dividends have been and what you might expect in the future.
Ex-Dividend Date
2022-03-16
Dividend Yield
0%
Annual Dividend
$150.00
P/E Ratio
26.43
Payout Ratio
0
Dividend per Share
$0
EPS
26.85
| Ex-Date/EFF Date | Dividend Amount | Adjusted Dividend | Payment Date | Declaration Date |
|---|---|---|---|---|
| 2022-03-16 | $150 | $150 | 2022-04-03 | |
| 2021-03-02 | $150 | $150 | 2021-04-05 | |
| 2019-04-02 | $120 | $120 | 2019-04-10 | |
| 2018-03-20 | $120 | $120 | 2018-04-01 | |
| 2017-08-29 | $110 | $110 | 2017-09-14 | |
| 2016-08-22 | $110 | $110 | ||
| 2015-11-10 | $220 | $220 | ||
| 2015-05-19 | $120 | $120 | ||
| 2014-06-02 | $110 | $110 | ||
| 2013-08-12 | $99.9265 | $99.9265 | ||
| 2013-04-02 | $50 | $50 |
I.E.S Holdings Ltd (IES.TA) Dividend History Chart
The table below shows I.E.S Holdings Ltd (IES.TA) dividend history over the years, including the amount per share, the payout date, and any adjustments for stock splits.
I.E.S Holdings Ltd (IES.TA) Dividend Growth
I.E.S Holdings Ltd (IES.TA) dividend history also allows you to track its dividend growth over time. This gives you insight into how the company’s earnings and payout ratios have evolved. Tracking this growth can help you gauge the stock's potential for future income.
Other Popular Dividend Stocks
Check out the dividend history of other popular stocks:
Track & Identify Dividend Stocks
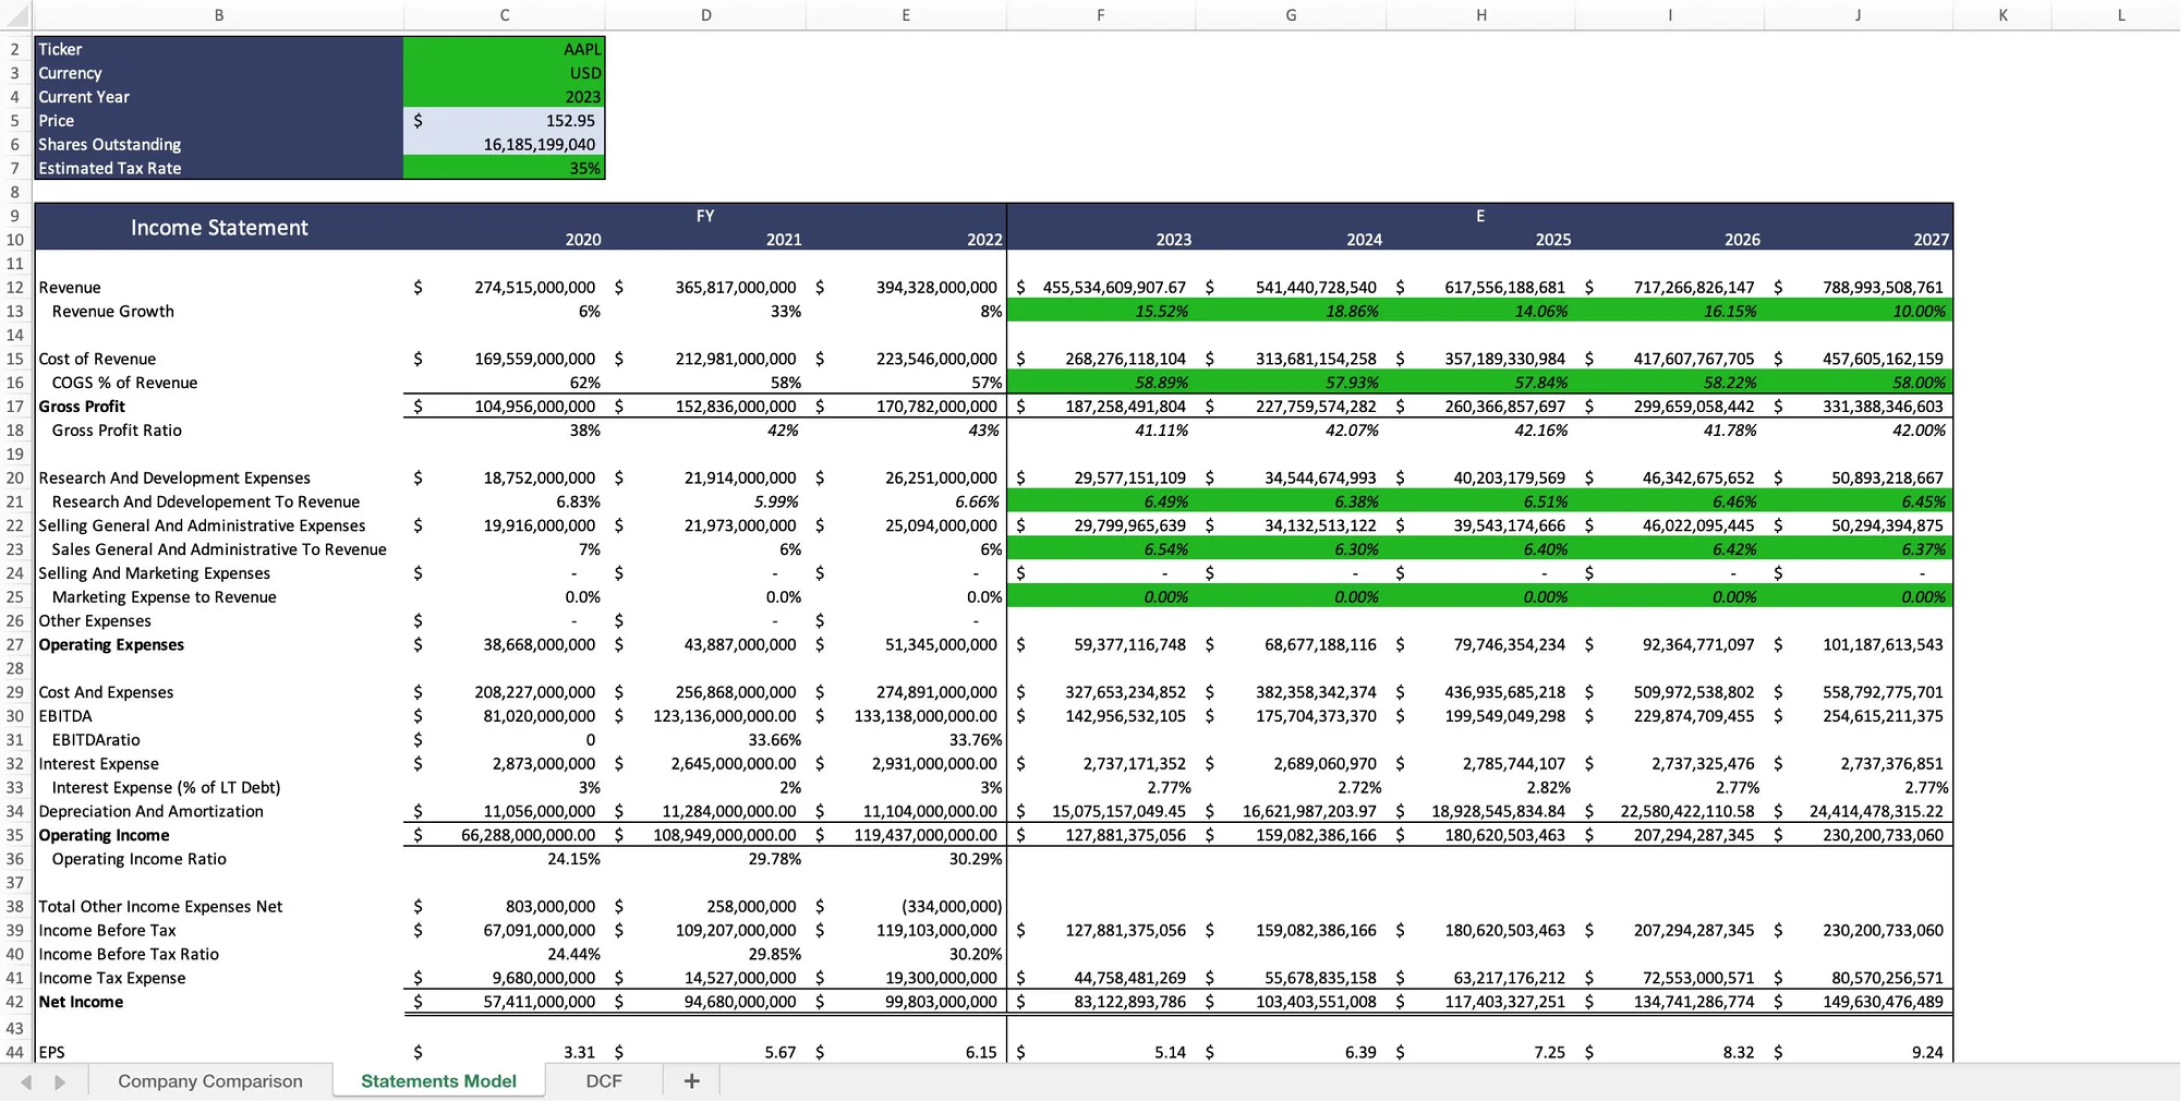
Tracking and finding valuable dividend stocks to invest in is difficult. For this, you can use Wisesheets, which allows you to pull all necessary dividend, financial, and price data to track your dividend investments in one place exactly how you want, using the power of spreadsheets.
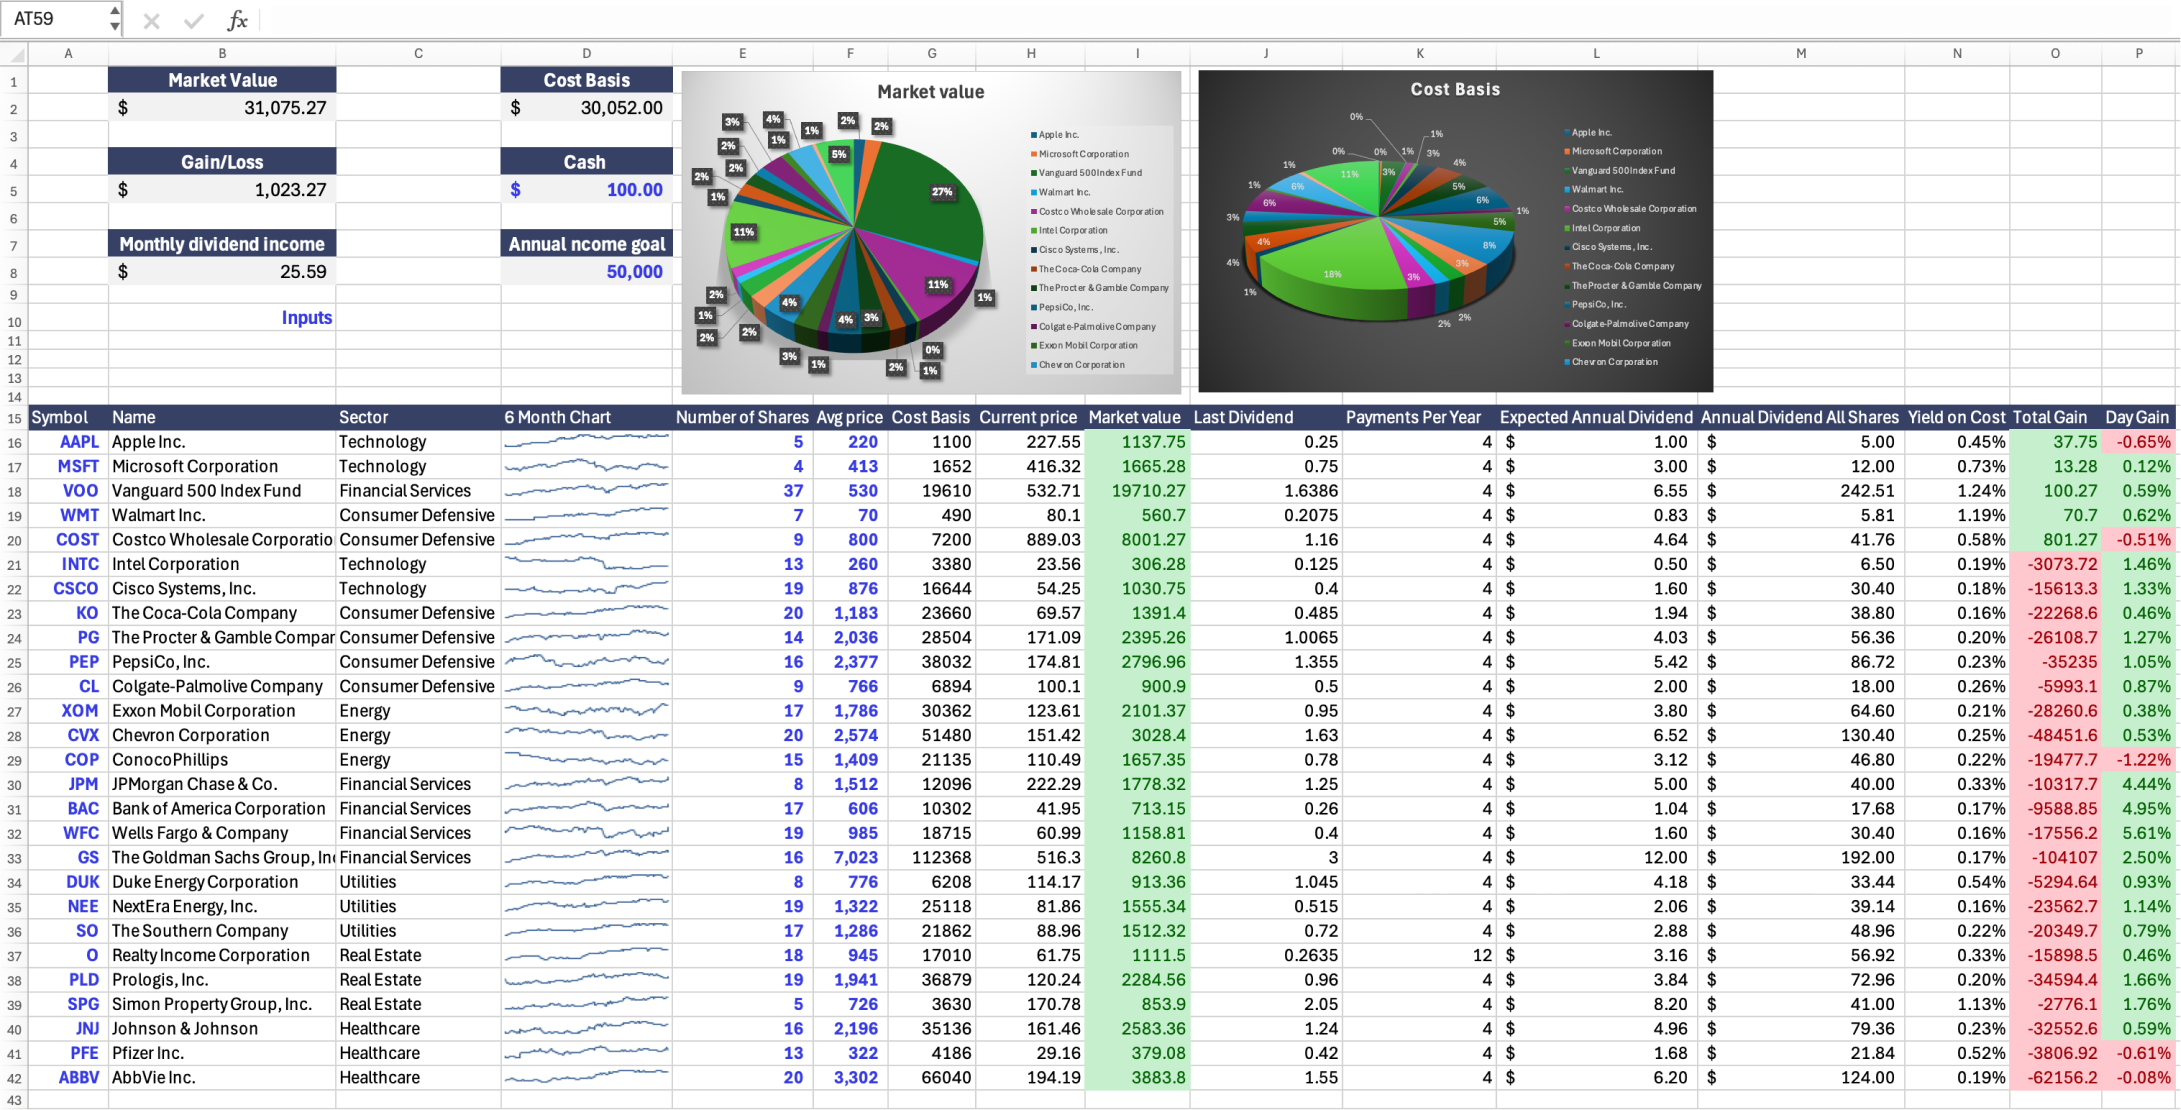
You can build any custom analysis dashboards, screeners and trackers with no code and analyze companies like I.E.S Holdings Ltd (IES.TA) without the pain and hassle of copy pasting data.
Frequently asked questions❓
What is dividend history?
How do I check past dividend history?
What does the ex-dividend date mean?
What is IES.TA’s dividend yield?
What is the difference between regular and special dividends?
Has IES.TA increased its dividends over time?
Why might dividend history data be delayed?
How often does IES.TA pay dividends?
What factors impact IES.TA's dividend payments?
Can dividends change over time?
What is IES.TA’s next dividend date?