
Shopify Inc. - ROE
307.F
Price:
$145
Market Cap:
$207.77B
Shopify Inc. is a leading commerce technology company, providing a comprehensive platform and related services to businesses across Canada, the United States, Europe, the Middle East, Africa, the Asia Pacific region, and Latin America. Its versatile platform empowers merchants to efficiently showcase, manage, market, and sell their products through a diverse range of sales channels. These include web and mobile storefronts, physical retail outlets, temporary pop-up shops, various social media platforms, native mobile applications, embeddable buy buttons, and online marketplaces. Beyond sales, Shopify's ecosystem facilitates core business operations, such as inventory and product management, ...[Read more]
Industry
Software - Application
IPO Date
2015-05-28
Stock Exchange
FSX
Ticker
307.F
PE Ratio
[105.59]
ROE
[15.06%]
Current Ratio
[5.35]
Dividend Yield
[0%]
Enterprise Value
[206.29B]
Dividend History
The ROE as of October 2026 (TTM) for Shopify Inc. (307.F) is 15.06%
According to Shopify Inc.’s latest financial reports and current stock price. The company's current ROE is 15.06%. This represents a change of 306.12% compared to the average of 3.71% of the last 4 quarters.
Shopify Inc. (307.F) Historical ROE (quarterly & annually)
How has 307.F ROE performed in the past?
The mean historical ROE of Shopify Inc. over the last ten years is -0.26%. The current 15.06% ROE has changed -5897.16% with respect to the historical average. Over the past ten years (40 quarters), 307.F's ROE was at its highest in in the March 2021 quarter at 13.77%. The ROE was at its lowest in in the June 2023 quarter at -17.57%.
Average
-0.26%
Median
-0.82%
Minimum
-42.00%
Maximum
26.18%
Shopify Inc. (307.F) ROE by Quarter and Year
Discovering the peaks and valleys of Shopify Inc. ROE, unveiling quarterly and yearly fluctuations to gain insights into the company’s financial performance and market dynamics, offering valuable data for investors and analysts alike.
Maximum Annual Increase = 1.10%
Maximum Annual ROE = 26.18%
Minimum Annual Increase = -260.41%
Minimum Annual ROE = -42.00%
| Year | ROE | Change |
|---|---|---|
| 2025 | 9.14% | -47.70% |
| 2024 | 17.47% | 1.10% |
| 2023 | 1.46% | -103.47% |
| 2022 | -42.00% | -260.41% |
| 2021 | 26.18% | 424.45% |
| 2020 | 4.99% | -220.58% |
| 2019 | -4.14% | 34.08% |
| 2018 | -3.09% | -22.72% |
| 2017 | -4.00% | -53.62% |
| 2016 | -8.61% | -10.47% |
Shopify Inc. (307.F) Average ROE
How has 307.F ROE performed in the past?
The current ROE of Shopify Inc. (307.F) is less than than its 3-year, less than than its 5-year, and greater than its 10-year historical averages
3-year avg
9.35%
5-year avg
2.45%
10-year avg
-0.26%
Shopify Inc. (307.F) ROE vs. Peers
How is 307.F’s ROE compared to its peers?
Shopify Inc.’s ROE is less than Salesforce, Inc. (20.15%), less than Salesforce, Inc. (20.15%), less than Intuit Inc. (23.42%), less than SAP SE (17.60%), less than QUALCOMM Incorporated (37.33%), less than Applied Materials, Inc. (40.44%), less than Micron Technology, Inc. (91.77%), less than Cadence Design Systems, Inc. (22.88%), less than Autodesk, Inc. (52.50%), less than International Business Machines Corporation (33.52%),
| Company | ROE | Market cap |
|---|---|---|
| 20.15% | $169.70B | |
| 20.15% | $168.18B | |
| 23.42% | $70.11B | |
| 17.60% | $219.30B | |
| 37.33% | $170.02B | |
| 40.44% | $383.01B | |
| 91.77% | $1.06T | |
| 22.88% | $86.46B | |
| 52.50% | $41.87B | |
| 33.52% | $186.75B |
Build a custom stock screener for Shopify Inc. (307.F) and other stocks
One of the best ways to find valuable stocks to invest in is to build a custom made screener in your Excel or Google Sheets spreadsheet. This allows you to compare thousands of companies like Shopify Inc. using the financials and key metrics that matter to you in a single view.
The easiest way to set this up is to use the Wisesheets add-on and set your spreadsheet like this:
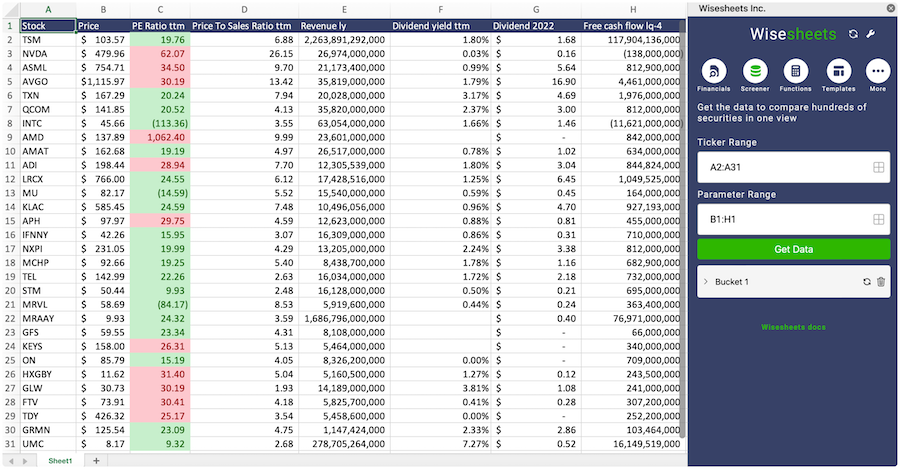
Covering all these metrics from financial, data, dividend data, key metrics and more you can get all the data you want for over 50+ exchanges worldwide.
Get your free trial here.
Shopify Inc. (307.F) and other stocks custom spreadsheet templates
The easiest way to analyze a company like Shopify Inc. or any others is to create a spreadsheet model that automatically retrieves all of the stock data you need.
Using Wisesheets you can set up a spreadsheet model like this with simple spreadsheet formulas. If you change the ticker you can get all of the data automatically updated for you.
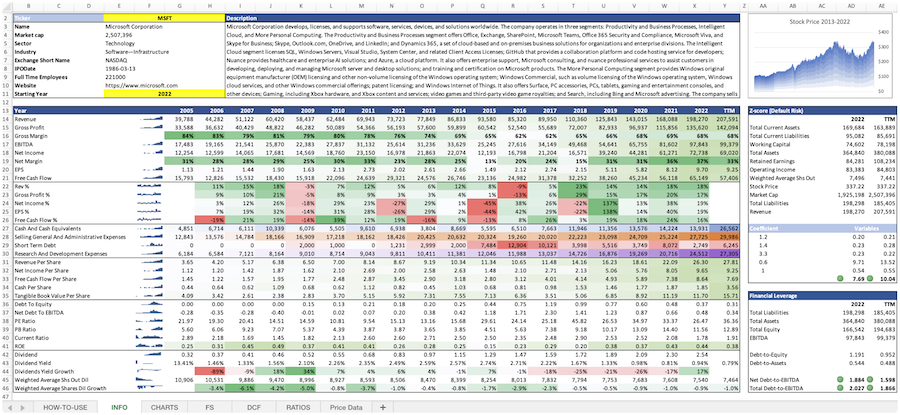
Whether you need live data, historical price data, financials, dividend data, key metrics, analyst estimates, or anything else...Wisesheets has you covered.
Frequently asked questions❓
What is the ROE?
How can you use the ROE?
What is Shopify Inc.'s ROE?
How is the ROE calculated for Shopify Inc. (307.F)?
What is the highest ROE for Shopify Inc. (307.F)?
What is the 3-year average ROE for Shopify Inc. (307.F)?
What is the 5-year average ROE for Shopify Inc. (307.F)?
How does the current ROE for Shopify Inc. (307.F) compare to its historical average?