
PJSC Polyus - PE Ratio
PLZL.ME
Price:
$1350
Market Cap:
$1.82T
Public Joint Stock Company Polyus, alongside its associated enterprises, specializes in the mining, processing, and distribution of gold. Its principal activities are conducted throughout various Russian territories, including the Krasnoyarsk, Irkutsk, Magadan, and Amur regions, as well as the Republic of Sakha. The company's undertakings also extend to geological exploration and research. Founded in 2005, Polyus is headquartered in Moscow, Russia.
Industry
Gold
IPO Date
2010-03-03
Stock Exchange
MCX
Ticker
PLZL.ME
PE Ratio
[0.94]
ROE
[124.65%]
Current Ratio
[4.44]
Dividend Yield
[14.27%]
Enterprise Value
[2.37T]
Dividend History
The PE Ratio as of October 2026 (TTM) for PJSC Polyus (PLZL.ME) is 0.94
According to PJSC Polyus’s latest financial reports and current stock price. The company's current PE Ratio is 0.94. This represents a change of -65.07% compared to the average of 2.69 of the last 4 quarters.
PJSC Polyus (PLZL.ME) Historical PE Ratio (quarterly & annually)
How has PLZL.ME PE Ratio performed in the past?
The mean historical PE Ratio of PJSC Polyus over the last ten years is 10.48. The current 0.94 PE Ratio has changed 797.69% with respect to the historical average. Over the past ten years (40 quarters), PLZL.ME's PE Ratio was at its highest in in the December 2017 quarter at 40.92. The PE Ratio was at its lowest in in the December 2018 quarter at -72.09.
Average
10.48
Median
8.20
Minimum
4.52
Maximum
25.26
PJSC Polyus (PLZL.ME) PE Ratio by Quarter and Year
Discovering the peaks and valleys of PJSC Polyus PE Ratio, unveiling quarterly and yearly fluctuations to gain insights into the company’s financial performance and market dynamics, offering valuable data for investors and analysts alike.
Maximum Annual Increase = 208.49%
Maximum Annual PE Ratio = 25.26
Minimum Annual Increase = -69.89%
Minimum Annual PE Ratio = 4.52
| Year | PE Ratio | Change |
|---|---|---|
| 2025 | 7.25 | 60.42% |
| 2024 | 4.52 | -44.95% |
| 2023 | 8.20 | -12.34% |
| 2022 | 9.36 | -11.51% |
| 2021 | 10.58 | -38.43% |
| 2020 | 17.18 | 125.89% |
| 2019 | 7.61 | -69.89% |
| 2018 | 25.26 | 208.49% |
| 2017 | 8.19 | 22.93% |
| 2016 | 6.66 | -26.76% |
PJSC Polyus (PLZL.ME) Average PE Ratio
How has PLZL.ME PE Ratio performed in the past?
The current PE Ratio of PJSC Polyus (PLZL.ME) is less than than its 3-year, less than than its 5-year, and less than than its 10-year historical averages
3-year avg
6.66
5-year avg
7.98
10-year avg
10.48
PJSC Polyus (PLZL.ME) PE Ratio vs. Peers
How is PLZL.ME’s PE Ratio compared to its peers?
PJSC Polyus’s PE Ratio is less than Public Joint Stock Company Mining and Metallurgical Company Norilsk Nickel (7.70), greater than Public joint-stock company Seligdar (-3.76), less than Public Joint Stock Company Buryatzoloto (5.50), greater than Lena Gold-Mining Public Joint Stock Company Lenzoloto (0.01), greater than Lena Gold-Mining Public Joint Stock Company Lenzoloto (0.01), less than Public Joint Stock Company "Novolipetsk Steel" (10.18), less than United Company RUSAL, International Public Joint-Stock Company (104.18), less than Public Joint Stock Company Severstal (55.24), greater than Public Joint Stock Company Magnitogorsk Iron & Steel Works (-6.73), less than En+ Group International public joint-stock company (2.71),
| Company | PE Ratio | Market cap |
|---|---|---|
| 7.70 | $1.81T | |
| -3.76 | $43.00B | |
| 5.50 | $8.49B | |
| 0.01 | $1.66B | |
| 0.01 | $1.44B | |
| 10.18 | $468.67B | |
| 104.18 | $386.74B | |
| 55.24 | $605.84B | |
| -6.73 | $259.58B | |
| 2.71 | $203.38B |
Build a custom stock screener for PJSC Polyus (PLZL.ME) and other stocks
One of the best ways to find valuable stocks to invest in is to build a custom made screener in your Excel or Google Sheets spreadsheet. This allows you to compare thousands of companies like PJSC Polyus using the financials and key metrics that matter to you in a single view.
The easiest way to set this up is to use the Wisesheets add-on and set your spreadsheet like this:
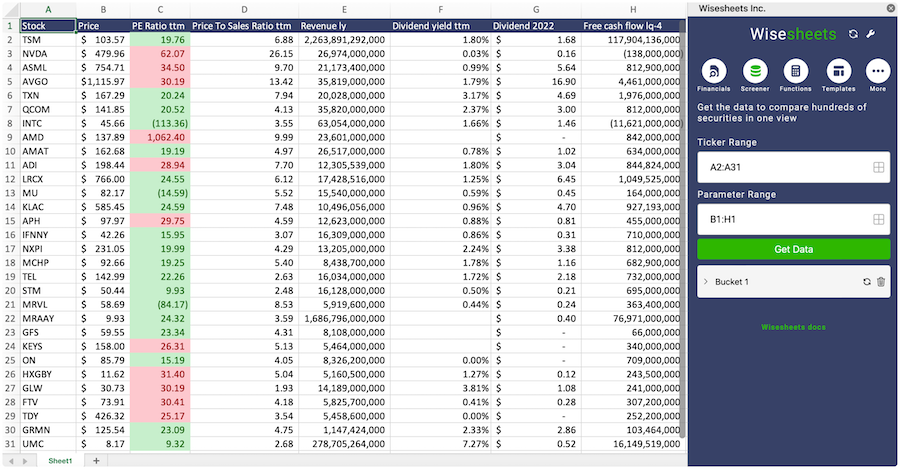
Covering all these metrics from financial, data, dividend data, key metrics and more you can get all the data you want for over 50+ exchanges worldwide.
Get your free trial here.
PJSC Polyus (PLZL.ME) and other stocks custom spreadsheet templates
The easiest way to analyze a company like PJSC Polyus or any others is to create a spreadsheet model that automatically retrieves all of the stock data you need.
Using Wisesheets you can set up a spreadsheet model like this with simple spreadsheet formulas. If you change the ticker you can get all of the data automatically updated for you.
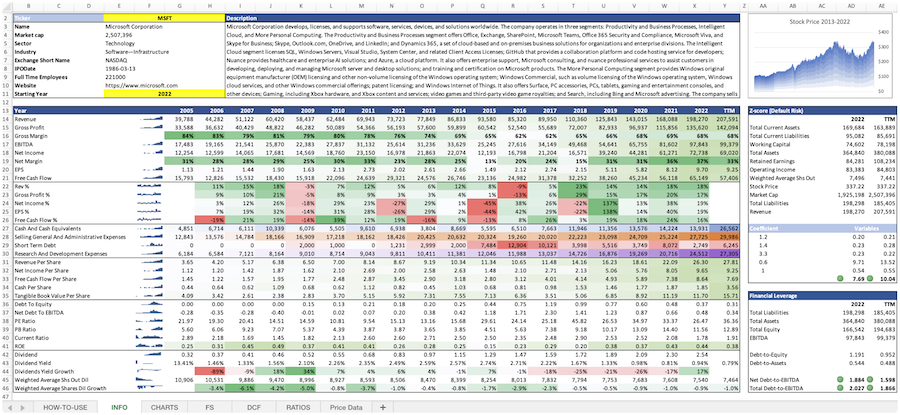
Whether you need live data, historical price data, financials, dividend data, key metrics, analyst estimates, or anything else...Wisesheets has you covered.
Frequently asked questions❓
What is the PE Ratio?
How can you use the PE Ratio?
What is PJSC Polyus's PE Ratio?
How is the PE Ratio calculated for PJSC Polyus (PLZL.ME)?
What is the highest PE Ratio for PJSC Polyus (PLZL.ME)?
What is the 3-year average PE Ratio for PJSC Polyus (PLZL.ME)?
What is the 5-year average PE Ratio for PJSC Polyus (PLZL.ME)?
How does the current PE Ratio for PJSC Polyus (PLZL.ME) compare to its historical average?