
Kalpataru Projects International Limited - PE Ratio
KPIL.NS
Price:
$1395.7
Market Cap:
$238.35B
Kalpataru Projects International Limited (KPIL) is a global provider of comprehensive engineering, procurement, and construction (EPC) services. The company specializes in a diverse range of critical infrastructure sectors, including power transmission and distribution, civil construction (such as buildings, factories, roads, bridges, and water infrastructure), railways (track laying, electrification, and associated systems), and oil and gas pipelines. Its operations extend across India and numerous international markets. Operating through its Engineering, Procurement, and Construction (EPC) and Developmental Project segments, KPIL offers end-to-end, turnkey solutions. These services encompa...[Read more]
Industry
Engineering & Construction
IPO Date
2023-05-30
Stock Exchange
NSE
Ticker
KPIL.NS
PE Ratio
[21.93]
ROE
[15.46%]
Current Ratio
[0]
Dividend Yield
[0.79%]
Enterprise Value
[238.35B]
Dividend History
The PE Ratio as of October 2026 (TTM) for Kalpataru Projects International Limited (KPIL.NS) is 21.93
According to Kalpataru Projects International Limited’s latest financial reports and current stock price. The company's current PE Ratio is 21.93. This represents a change of 2.82% compared to the average of 21.33 of the last 4 quarters.
Kalpataru Projects International Limited (KPIL.NS) Historical PE Ratio (quarterly & annually)
How has KPIL.NS PE Ratio performed in the past?
The mean historical PE Ratio of Kalpataru Projects International Limited over the last ten years is 19.36. The current 21.93 PE Ratio has changed 11.23% with respect to the historical average. Over the past ten years (40 quarters), KPIL.NS's PE Ratio was at its highest in in the June 2019 quarter at 164.63. The PE Ratio was at its lowest in in the March 2007 quarter at 0.
Average
19.36
Median
17.88
Minimum
7.23
Maximum
35.62
Kalpataru Projects International Limited (KPIL.NS) PE Ratio by Quarter and Year
Discovering the peaks and valleys of Kalpataru Projects International Limited PE Ratio, unveiling quarterly and yearly fluctuations to gain insights into the company’s financial performance and market dynamics, offering valuable data for investors and analysts alike.
Maximum Annual Increase = 93.76%
Maximum Annual PE Ratio = 35.62
Minimum Annual Increase = -53.93%
Minimum Annual PE Ratio = 7.23
| Year | PE Ratio | Change |
|---|---|---|
| 2026 | 17.37 | -37.24% |
| 2025 | 27.67 | -22.32% |
| 2024 | 35.62 | 93.76% |
| 2023 | 18.38 | 81.86% |
| 2022 | 10.11 | 18.65% |
| 2021 | 8.52 | 17.78% |
| 2020 | 7.23 | -53.93% |
| 2019 | 15.70 | -40.61% |
| 2018 | 26.44 | -0.46% |
| 2017 | 26.56 | -36.03% |
Kalpataru Projects International Limited (KPIL.NS) Average PE Ratio
How has KPIL.NS PE Ratio performed in the past?
The current PE Ratio of Kalpataru Projects International Limited (KPIL.NS) is less than than its 3-year, greater than its 5-year, and greater than its 10-year historical averages
3-year avg
26.89
5-year avg
21.83
10-year avg
19.36
Kalpataru Projects International Limited (KPIL.NS) PE Ratio vs. Peers
How is KPIL.NS’s PE Ratio compared to its peers?
Kalpataru Projects International Limited’s PE Ratio is greater than KEC International Limited (17.12), greater than Transrail Lighting Limited (0), less than Bajel Projects Limited (82.52), less than Techno Electric & Engineering Company Limited (25.50), greater than Ircon International Limited (19.09), less than Rail Vikas Nigam Limited (45.65), greater than NCC Limited (11.11), less than Larsen & Toubro Limited (27.86), greater than GMR Power and Urban Infra Limited (12.37), greater than KNR Constructions Limited (7.96),
| Company | PE Ratio | Market cap |
|---|---|---|
| 17.12 | $94.79B | |
| 0 | $62.68B | |
| 82.52 | $18.17B | |
| 25.50 | $109.93B | |
| 19.09 | $100.01B | |
| 45.65 | $410.21B | |
| 11.11 | $77.71B | |
| 27.86 | $5.00T | |
| 12.37 | $77.94B | |
| 7.96 | $31.39B |
Build a custom stock screener for Kalpataru Projects International Limited (KPIL.NS) and other stocks
One of the best ways to find valuable stocks to invest in is to build a custom made screener in your Excel or Google Sheets spreadsheet. This allows you to compare thousands of companies like Kalpataru Projects International Limited using the financials and key metrics that matter to you in a single view.
The easiest way to set this up is to use the Wisesheets add-on and set your spreadsheet like this:
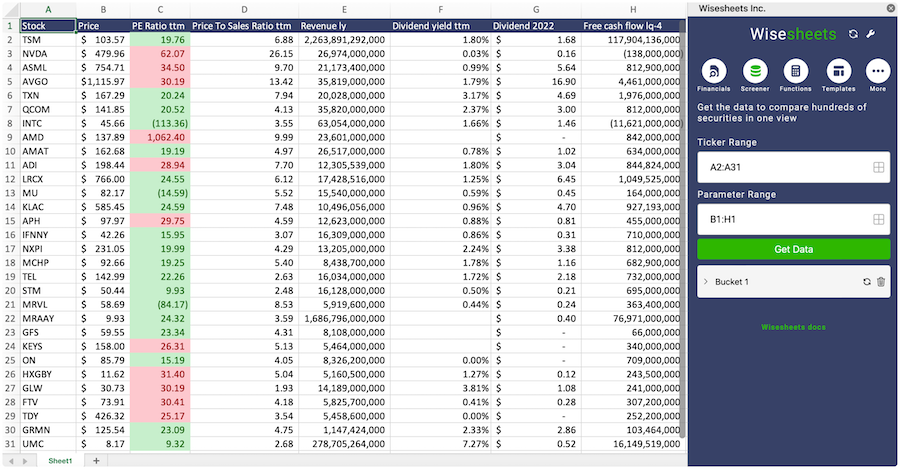
Covering all these metrics from financial, data, dividend data, key metrics and more you can get all the data you want for over 50+ exchanges worldwide.
Get your free trial here.
Kalpataru Projects International Limited (KPIL.NS) and other stocks custom spreadsheet templates
The easiest way to analyze a company like Kalpataru Projects International Limited or any others is to create a spreadsheet model that automatically retrieves all of the stock data you need.
Using Wisesheets you can set up a spreadsheet model like this with simple spreadsheet formulas. If you change the ticker you can get all of the data automatically updated for you.
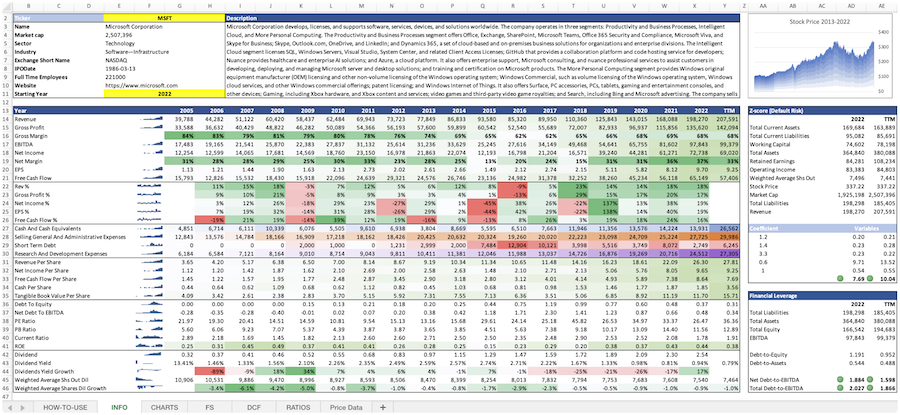
Whether you need live data, historical price data, financials, dividend data, key metrics, analyst estimates, or anything else...Wisesheets has you covered.
Frequently asked questions❓
What is the PE Ratio?
How can you use the PE Ratio?
What is Kalpataru Projects International Limited's PE Ratio?
How is the PE Ratio calculated for Kalpataru Projects International Limited (KPIL.NS)?
What is the highest PE Ratio for Kalpataru Projects International Limited (KPIL.NS)?
What is the 3-year average PE Ratio for Kalpataru Projects International Limited (KPIL.NS)?
What is the 5-year average PE Ratio for Kalpataru Projects International Limited (KPIL.NS)?
How does the current PE Ratio for Kalpataru Projects International Limited (KPIL.NS) compare to its historical average?