Saudi Fisheries Company
6050.SR
Price:
$64.05
Market Cap:
$428.94M
Saudi Fisheries Company engages in fishing, fish-farming, and marketing activities in the Kingdom of Saudi Arabia. The company's seafood products include hareed, hamour baloul, zubaidi, shaour emperor, andak red sea bream, dennis seabream, qarous sea bass, hamor seaman, and nagel fish, as well as crab, peeled shrimp, lobster, squid, and salmon and knad steaks. It also offers meal products, including salmon grilled with rice, sweet sour shrimp with rice, tempura fish, fried prawns with potatoes, daqoos, flour, thome, green salad, spiced eggplant, rabban timbora, his sanctity, and chickpeas, as well as frozen shrimp. In addition, the company is involved in the operation of fish and shrimp farm...[Read more]
Industry
Agricultural Farm Products
IPO Date
2010-03-03
Stock Exchange
SAU
Ticker
6050.SR
PE Ratio
[-39.05]
ROE
[-16.25%]
Current Ratio
[0.33]
Dividend Yield
[0%]
Enterprise Value
[433.16M]
Dividend History
The PE Ratio as of December 2025 (TTM) for Saudi Fisheries Company (6050.SR) is -39.05
According to Saudi Fisheries Company’s latest financial reports and current stock price. The company's current PE Ratio is -39.05. This represents a change of 0.22% compared to the average of -38.97 of the last 4 quarters.
Saudi Fisheries Company (6050.SR) Historical PE Ratio (quarterly & annually)
How has 6050.SR PE Ratio performed in the past?
The mean historical PE Ratio of Saudi Fisheries Company over the last ten years is -122.01. The current -39.05 PE Ratio has changed 3.10% with respect to the historical average. Over the past ten years (40 quarters), 6050.SR's PE Ratio was at its highest in in the March 2023 quarter at 1.80K. The PE Ratio was at its lowest in in the September 2020 quarter at -534.43.
Average
-122.01
Median
-84.63
Minimum
-317.92
Maximum
-21.41
Saudi Fisheries Company (6050.SR) PE Ratio by Quarter and Year
Discovering the peaks and valleys of Saudi Fisheries Company PE Ratio, unveiling quarterly and yearly fluctuations to gain insights into the company’s financial performance and market dynamics, offering valuable data for investors and analysts alike.
Maximum Annual Increase = 193.09%
Maximum Annual PE Ratio = -21.41
Minimum Annual Increase = -69.97%
Minimum Annual PE Ratio = -317.92
| Year | PE Ratio | Change |
|---|---|---|
| 2024 | -21.41 | -66.35% |
| 2023 | -63.62 | -33.37% |
| 2022 | -95.48 | -69.97% |
| 2021 | -317.92 | 9.62% |
| 2020 | -290.03 | 193.09% |
| 2019 | -98.95 | -22.04% |
| 2018 | -126.93 | 106.89% |
| 2017 | -61.35 | -16.83% |
| 2016 | -73.77 | 4.52% |
| 2015 | -70.58 | -47.21% |
Saudi Fisheries Company (6050.SR) Average PE Ratio
How has 6050.SR PE Ratio performed in the past?
The current PE Ratio of Saudi Fisheries Company (6050.SR) is greater than its 3-year, greater than its 5-year, and greater than its 10-year historical averages
3-year avg
-60.17
5-year avg
-157.69
10-year avg
-122.01
Saudi Fisheries Company (6050.SR) PE Ratio vs. Peers
How is 6050.SR’s PE Ratio compared to its peers?
Saudi Fisheries Company’s PE Ratio is less than Jazan Development and Investment Company (-6.25), less than Al Gassim Investment Holding Company (34.65), less than Ash-Sharqiyah Development Co. (-21.82), less than Wafrah for Industry and Development Company (-14.91), less than Tabuk Agricultural Development Company (-2.07), less than Anaam International Holding Group Company (-33.72), greater than Thimar Development Holding Company (-68.71), less than Balady Poultry Trading Co. (18.53), less than Leen Alkhair Trading Company (53.93), less than Academy Of Learning Company (34.32),
| Company | PE Ratio | Market cap |
|---|---|---|
| -6.25 | $430.00M | |
| 34.65 | $486.30M | |
| -21.82 | $420.00M | |
| -14.91 | $501.22M | |
| -2.07 | $309.89M | |
| -33.72 | $372.01M | |
| -68.71 | $251.55M | |
| 18.53 | $808.11M | |
| 53.93 | $150.14M | |
| 34.32 | $948.60M |
Build a custom stock screener for Saudi Fisheries Company (6050.SR) and other stocks
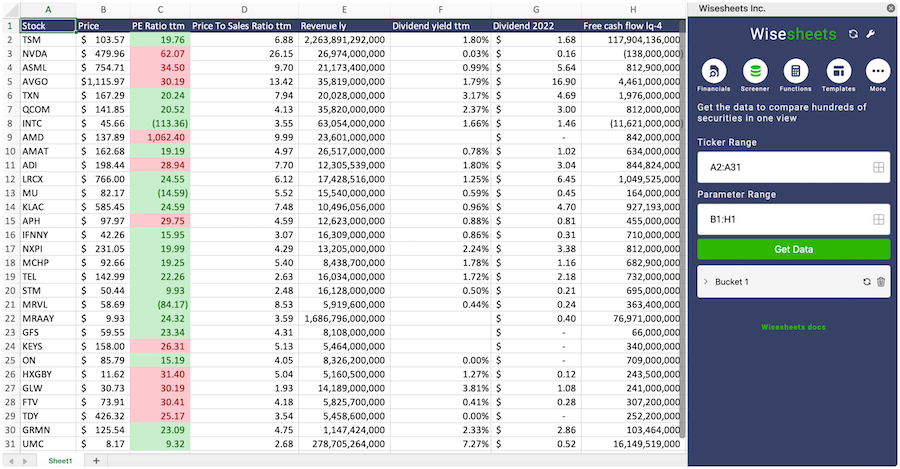
One of the best ways to find valuable stocks to invest in is to build a custom made screener in your Excel or Google Sheets spreadsheet. This allows you to compare thousands of companies like Saudi Fisheries Company using the financials and key metrics that matter to you in a single view.
The easiest way to set this up is to use the Wisesheets add-on and set your spreadsheet like this:
Covering all these metrics from financial, data, dividend data, key metrics and more you can get all the data you want for over 50+ exchanges worldwide.
Get your free trial here.
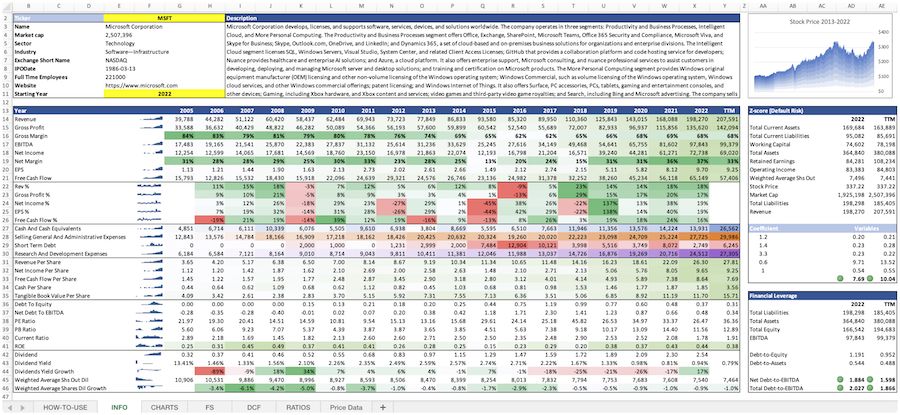
Saudi Fisheries Company (6050.SR) and other stocks custom spreadsheet templates
The easiest way to analyze a company like Saudi Fisheries Company or any others is to create a spreadsheet model that automatically retrieves all of the stock data you need.
Using Wisesheets you can set up a spreadsheet model like this with simple spreadsheet formulas. If you change the ticker you can get all of the data automatically updated for you.
Whether you need live data, historical price data, financials, dividend data, key metrics, analyst estimates, or anything else...Wisesheets has you covered.
Frequently asked questions❓
What is the PE Ratio?
How can you use the PE Ratio?
What is Saudi Fisheries Company's PE Ratio?
How is the PE Ratio calculated for Saudi Fisheries Company (6050.SR)?
What is the highest PE Ratio for Saudi Fisheries Company (6050.SR)?
What is the 3-year average PE Ratio for Saudi Fisheries Company (6050.SR)?
What is the 5-year average PE Ratio for Saudi Fisheries Company (6050.SR)?
How does the current PE Ratio for Saudi Fisheries Company (6050.SR) compare to its historical average?

