Ningbo Tuopu Group Co.,Ltd.
601689.SS
Price:
$69.27
Market Cap:
$120.38B
Ningbo Tuopu Group Co.,Ltd. engages in the manufacture and sale of automobile parts in China and internationally. It offers vibration control products, including powertrain mounting systems, chassis bushings, rubber metal parts, torsional vibrational dampers, and aluminum die-casting products; headliners, pedal pads, cloth racks, and floor carpets for interior trims; spare wheel cover, side plaque, and interior trimming board for trunk trims; interior trim materials; and sound, heat, and silencer insulation pads, as well as insulation lining od wheel housing. The company also provides automatic driving systems, such as intelligent brake systems, electric power steering columns, automotive me...[Read more]
Industry
Auto - Parts
IPO Date
2015-03-19
Stock Exchange
SHH
Ticker
601689.SS
PE Ratio
[43.57]
ROE
[12.41%]
Current Ratio
[1.28]
Dividend Yield
[0.75%]
Enterprise Value
[126.20B]
Dividend History
The Enterprise Value as of December 2025 (TTM) for Ningbo Tuopu Group Co.,Ltd. (601689.SS) is 126.20B
According to Ningbo Tuopu Group Co.,Ltd.’s latest financial reports and current stock price. The company's current Enterprise Value is 126.20B. This represents a change of 21.56% compared to the average of 103.82B of the last 4 quarters.
Ningbo Tuopu Group Co.,Ltd. (601689.SS) Historical Enterprise Value (quarterly & annually)
How has 601689.SS Enterprise Value performed in the past?
The mean historical Enterprise Value of Ningbo Tuopu Group Co.,Ltd. over the last ten years is 33.64B. The current 126.20B Enterprise Value has changed 37.42% with respect to the historical average. Over the past ten years (40 quarters), 601689.SS's Enterprise Value was at its highest in in the September 2025 quarter at 146.57B. The Enterprise Value was at its lowest in in the December 2018 quarter at 6.82B.
Average
33.64B
Median
20.29B
Minimum
6.88B
Maximum
83.53B
Ningbo Tuopu Group Co.,Ltd. (601689.SS) Enterprise Value by Quarter and Year
Discovering the peaks and valleys of Ningbo Tuopu Group Co.,Ltd. Enterprise Value, unveiling quarterly and yearly fluctuations to gain insights into the company’s financial performance and market dynamics, offering valuable data for investors and analysts alike.
Maximum Annual Increase = 118.74%
Maximum Annual Enterprise Value = 83.53B
Minimum Annual Increase = -38.60%
Minimum Annual Enterprise Value = 6.88B
| Year | Enterprise Value | Change |
|---|---|---|
| 2024 | 83.53B | 2.35% |
| 2023 | 81.61B | 69.56% |
| 2022 | 48.13B | 19.46% |
| 2021 | 40.29B | 46.14% |
| 2020 | 27.57B | 118.74% |
| 2019 | 12.60B | 83.15% |
| 2018 | 6.88B | -38.60% |
| 2017 | 11.21B | -13.90% |
| 2016 | 13.02B | 12.85% |
| 2015 | 11.53B | 91.81% |
Ningbo Tuopu Group Co.,Ltd. (601689.SS) Average Enterprise Value
How has 601689.SS Enterprise Value performed in the past?
The current Enterprise Value of Ningbo Tuopu Group Co.,Ltd. (601689.SS) is greater than its 3-year, greater than its 5-year, and greater than its 10-year historical averages
3-year avg
71.09B
5-year avg
56.23B
10-year avg
33.64B
Ningbo Tuopu Group Co.,Ltd. (601689.SS) Enterprise Value vs. Peers
How is 601689.SS’s Enterprise Value compared to its peers?
Ningbo Tuopu Group Co.,Ltd.’s Enterprise Value is greater than Zhejiang Century Huatong Group Co.,Ltd (117.49B), less than Hengli Petrochemical Co.,Ltd. (268.58B), greater than Kuang-Chi Technologies Co., Ltd. (108.00B), less than China Tourism Group Duty Free Corporation Limited (135.01B), less than Fuyao Glass Industry Group Co., Ltd. (161.77B), greater than Chongqing Changan Automobile Company Limited (76.26B), greater than Anhui Jianghuai Automobile Group Corp.,Ltd. (111.89B), greater than Huizhou Desay SV Automotive Co., Ltd. (68.84B), greater than HUAYU Automotive Systems Company Limited (55.95B), greater than Ningbo Joyson Electronic Corp. (61.16B),
| Company | Enterprise Value | Market cap |
|---|---|---|
| 117.49B | $124.69B | |
| 268.58B | $134.87B | |
| 108.00B | $112.15B | |
| 135.01B | $161.68B | |
| 161.77B | $162.05B | |
| 76.26B | $97.20B | |
| 111.89B | $104.81B | |
| 68.84B | $69.21B | |
| 55.95B | $62.87B | |
| 61.16B | $40.82B |
Build a custom stock screener for Ningbo Tuopu Group Co.,Ltd. (601689.SS) and other stocks
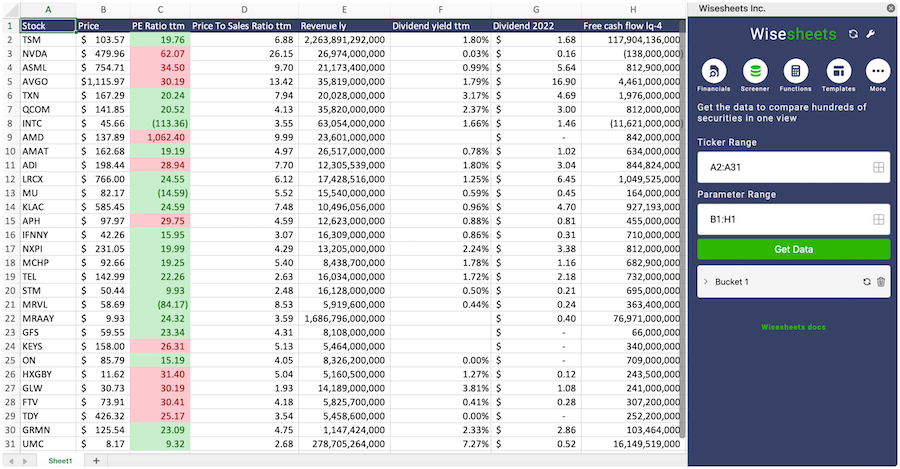
One of the best ways to find valuable stocks to invest in is to build a custom made screener in your Excel or Google Sheets spreadsheet. This allows you to compare thousands of companies like Ningbo Tuopu Group Co.,Ltd. using the financials and key metrics that matter to you in a single view.
The easiest way to set this up is to use the Wisesheets add-on and set your spreadsheet like this:
Covering all these metrics from financial, data, dividend data, key metrics and more you can get all the data you want for over 50+ exchanges worldwide.
Get your free trial here.
Ningbo Tuopu Group Co.,Ltd. (601689.SS) and other stocks custom spreadsheet templates
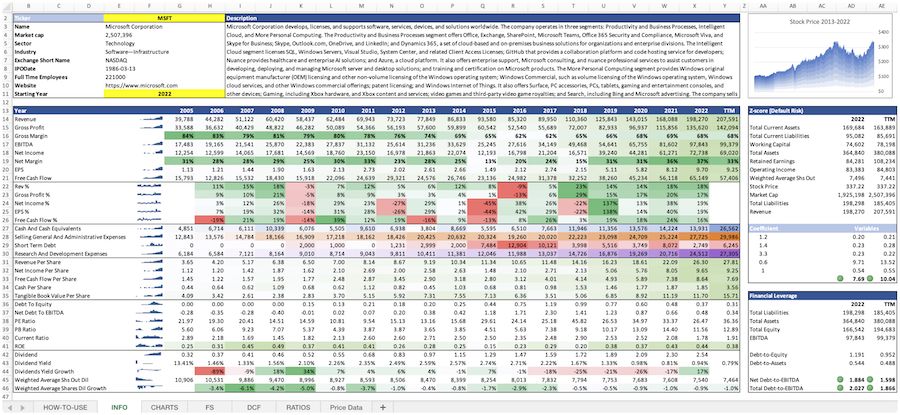
The easiest way to analyze a company like Ningbo Tuopu Group Co.,Ltd. or any others is to create a spreadsheet model that automatically retrieves all of the stock data you need.
Using Wisesheets you can set up a spreadsheet model like this with simple spreadsheet formulas. If you change the ticker you can get all of the data automatically updated for you.
Whether you need live data, historical price data, financials, dividend data, key metrics, analyst estimates, or anything else...Wisesheets has you covered.
Frequently asked questions❓
What is the Enterprise Value?
How can you use the Enterprise Value?
What is Ningbo Tuopu Group Co.,Ltd.'s Enterprise Value?
What is the highest Enterprise Value for Ningbo Tuopu Group Co.,Ltd. (601689.SS)?
What is the 3-year average Enterprise Value for Ningbo Tuopu Group Co.,Ltd. (601689.SS)?
What is the 5-year average Enterprise Value for Ningbo Tuopu Group Co.,Ltd. (601689.SS)?
How does the current Enterprise Value for Ningbo Tuopu Group Co.,Ltd. (601689.SS) compare to its historical average?

