
Télévision Française 1 S.A.
TFI.PA
Price:
$8.235
Market Cap:
$1.74B
Télévision Française 1 Société anonyme engages in the broadcasting, studios and entertainment, and digital businesses in France and internationally. The company offers DTT channels, including TMC, TFX, and TF1 Séries Films; Theme channels, such as TV Breizh, Ushuaïa TV, and Histoire TV; e-TF1; websites; and advertising services, as well as TF1, which covers sports, French drama, news, entertainment, sports, and movies. It also operates studios, including Newen Studios; TF1 Studio; and entertainment channel comprising TF1 Entertainment. In addition, the company operates Unify, a digital channel. Further, it offers digital market consulting, digital content management, theme channel. content/b...[Read more]
Industry
Broadcasting
IPO Date
1992-07-17
Stock Exchange
PAR
Ticker
TFI.PA
PE Ratio
[9.58]
ROE
[9.33%]
Current Ratio
[1.46]
Dividend Yield
[7.29%]
Enterprise Value
[1.33B]
Dividend History
The Dividend Yield as of December 2025 (TTM) for Télévision Française 1 S.A. (TFI.PA) is 7.29%
According to Télévision Française 1 S.A.’s latest financial reports and current stock price. The company's current Dividend Yield is 7.29%. This represents a change of 329.77% compared to the average of 1.70% of the last 4 quarters.
Télévision Française 1 S.A. (TFI.PA) Historical Dividend Yield (quarterly & annually)
How has TFI.PA Dividend Yield performed in the past?
The mean historical Dividend Yield of Télévision Française 1 S.A. over the last ten years is 6.17%. The current 7.29% Dividend Yield has changed 18.08% with respect to the historical average. Over the past ten years (40 quarters), TFI.PA's Dividend Yield was at its highest in in the June 2016 quarter at 8.36%. The Dividend Yield was at its lowest in in the September 2015 quarter at 0%.
Average
6.17%
Median
5.84%
Minimum
0%
Maximum
14.69%
Télévision Française 1 S.A. (TFI.PA) Dividend Yield by Quarter and Year
Discovering the peaks and valleys of Télévision Française 1 S.A. Dividend Yield, unveiling quarterly and yearly fluctuations to gain insights into the company’s financial performance and market dynamics, offering valuable data for investors and analysts alike.
Maximum Annual Increase = Infinity%
Maximum Annual Dividend Yield = 14.69%
Minimum Annual Increase = -100.00%
Minimum Annual Dividend Yield = 0%
| Year | Dividend Yield | Change |
|---|---|---|
| 2024 | 7.52% | 7.57% |
| 2023 | 6.99% | 11.22% |
| 2022 | 6.28% | 21.91% |
| 2021 | 5.15% | Infinity% |
| 2020 | 0% | -100.00% |
| 2019 | 5.40% | 9.13% |
| 2018 | 4.95% | 117.49% |
| 2017 | 2.27% | -73.10% |
| 2016 | 8.45% | -42.44% |
| 2015 | 14.69% | 236.95% |
Télévision Française 1 S.A. (TFI.PA) Average Dividend Yield
How has TFI.PA Dividend Yield performed in the past?
The current Dividend Yield of Télévision Française 1 S.A. (TFI.PA) is less than than its 3-year, less than than its 5-year, and less than than its 10-year historical averages
3-year avg
6.93%
5-year avg
5.19%
10-year avg
6.17%
Télévision Française 1 S.A. (TFI.PA) Dividend Yield vs. Peers
How is TFI.PA’s Dividend Yield compared to its peers?
Télévision Française 1 S.A.’s Dividend Yield is less than Métropole Télévision S.A. (9.97%), less than Louis Hachette Group S.A. (3.41%), less than NRJ Group S.A. (3.61%), less than SES S.A. (8.38%), greater than ADLPartner S.A. (0%), greater than Nextedia S.A. (0%), less than Hopscotch Global PR Group (5.08%), less than Reworld Media S.A. (1.31%), less than DNXCorp SE (3.31%), greater than Prismaflex International, S.A. (0%),
| Company | Dividend Yield | Market cap |
|---|---|---|
| 9.97% | $1.58B | |
| 3.41% | $1.49B | |
| 3.61% | $622.15M | |
| 8.38% | $2.31B | |
| 0% | $103.28M | |
| 0% | $15.45M | |
| 5.08% | $38.31M | |
| 1.31% | $86.15M | |
| 3.31% | $29.89M | |
| 0% | $9.27M |
Build a custom stock screener for Télévision Française 1 S.A. (TFI.PA) and other stocks
One of the best ways to find valuable stocks to invest in is to build a custom made screener in your Excel or Google Sheets spreadsheet. This allows you to compare thousands of companies like Télévision Française 1 S.A. using the financials and key metrics that matter to you in a single view.
The easiest way to set this up is to use the Wisesheets add-on and set your spreadsheet like this:
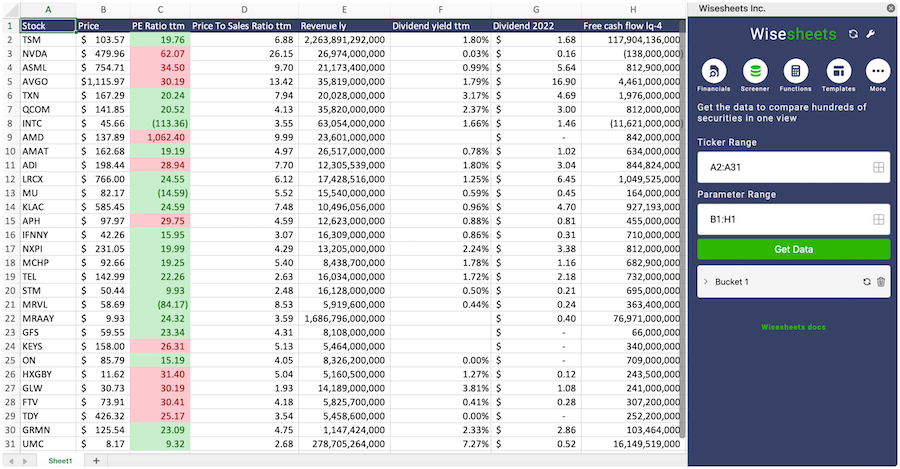
Covering all these metrics from financial, data, dividend data, key metrics and more you can get all the data you want for over 50+ exchanges worldwide.
Get your free trial here.
Télévision Française 1 S.A. (TFI.PA) and other stocks custom spreadsheet templates
The easiest way to analyze a company like Télévision Française 1 S.A. or any others is to create a spreadsheet model that automatically retrieves all of the stock data you need.
Using Wisesheets you can set up a spreadsheet model like this with simple spreadsheet formulas. If you change the ticker you can get all of the data automatically updated for you.
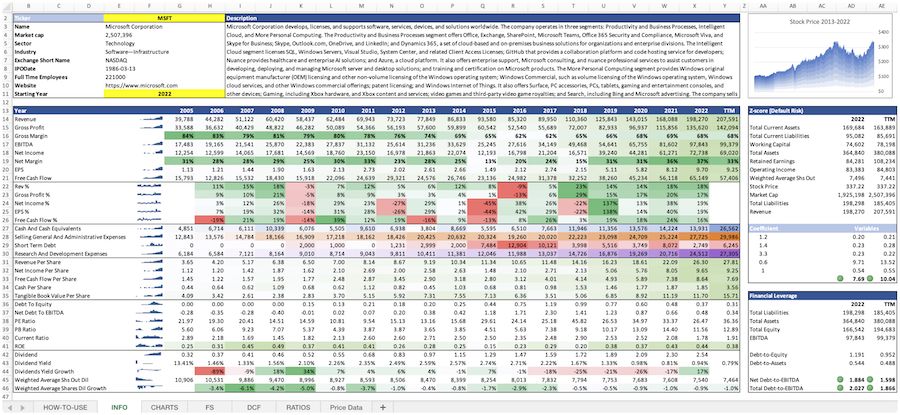
Whether you need live data, historical price data, financials, dividend data, key metrics, analyst estimates, or anything else...Wisesheets has you covered.
Frequently asked questions❓
What is the Dividend Yield?
How can you use the Dividend Yield?
What is Télévision Française 1 S.A.'s Dividend Yield?
How is the Dividend Yield calculated for Télévision Française 1 S.A. (TFI.PA)?
What is the highest Dividend Yield for Télévision Française 1 S.A. (TFI.PA)?
What is the 3-year average Dividend Yield for Télévision Française 1 S.A. (TFI.PA)?
What is the 5-year average Dividend Yield for Télévision Française 1 S.A. (TFI.PA)?
How does the current Dividend Yield for Télévision Française 1 S.A. (TFI.PA) compare to its historical average?