
Samsung Engineering Co., Ltd. - Dividend Yield
028050.KS
Price:
$39750
Market Cap:
$7.79T
Samsung Engineering Co., Ltd. delivers comprehensive engineering solutions across the globe. The firm manages projects from their initial conception, offering services that include feasibility assessments, financial planning, detailed engineering design, procurement of materials, construction, logistics and installation, system commissioning, ongoing operation and maintenance, and full-spectrum project management. They serve a variety of industries, focusing on both upstream and downstream sectors of the oil and gas industry, power generation plants, facilities for water and waste treatment, and a range of industrial manufacturing sites. Established in 1970, the company's central operations ...[Read more]
Industry
Engineering & Construction
IPO Date
2000-01-04
Stock Exchange
KSC
Ticker
028050.KS
PE Ratio
[12.40]
ROE
[14.38%]
Current Ratio
[1.46]
Dividend Yield
[1.99%]
Enterprise Value
[6.28T]
Dividend History
The Dividend Yield as of July 2026 (TTM) for Samsung Engineering Co., Ltd. (028050.KS) is 1.99%
According to Samsung Engineering Co., Ltd.’s latest financial reports and current stock price. The company's current Dividend Yield is 1.99%. This represents a change of 128.35% compared to the average of 0.87% of the last 4 quarters.
Samsung Engineering Co., Ltd. (028050.KS) Historical Dividend Yield (quarterly & annually)
How has 028050.KS Dividend Yield performed in the past?
The mean historical Dividend Yield of Samsung Engineering Co., Ltd. over the last ten years is 0.28%. The current 1.99% Dividend Yield has changed 622.58% with respect to the historical average. Over the past ten years (40 quarters), 028050.KS's Dividend Yield was at its highest in in the December 2025 quarter at 3.28%. The Dividend Yield was at its lowest in in the September 2016 quarter at 0%.
Average
0.28%
Median
0%
Minimum
0%
Maximum
2.74%
Samsung Engineering Co., Ltd. (028050.KS) Dividend Yield by Quarter and Year
Discovering the peaks and valleys of Samsung Engineering Co., Ltd. Dividend Yield, unveiling quarterly and yearly fluctuations to gain insights into the company’s financial performance and market dynamics, offering valuable data for investors and analysts alike.
Maximum Annual Increase = 0%
Maximum Annual Dividend Yield = 2.74%
Minimum Annual Increase = 0%
Minimum Annual Dividend Yield = 0%
| Year | Dividend Yield | Change |
|---|---|---|
| 2025 | 2.74% | 45.32% |
| 2024 | 0.01% | Infinity% |
| 2023 | 0% | 0% |
| 2022 | 0% | 0% |
| 2021 | 0% | 0% |
| 2020 | 0% | 0% |
| 2019 | 0% | 0% |
| 2018 | 0% | 0% |
| 2017 | 0% | 0% |
| 2016 | 0% | 0% |
Samsung Engineering Co., Ltd. (028050.KS) Average Dividend Yield
How has 028050.KS Dividend Yield performed in the past?
The current Dividend Yield of Samsung Engineering Co., Ltd. (028050.KS) is less than than its 3-year, less than than its 5-year, and less than than its 10-year historical averages
3-year avg
0.92%
5-year avg
0.55%
10-year avg
0.28%
Samsung Engineering Co., Ltd. (028050.KS) Dividend Yield vs. Peers
How is 028050.KS’s Dividend Yield compared to its peers?
Samsung Engineering Co., Ltd.’s Dividend Yield is less than Hyundai Engineering & Construction Co., Ltd. (0.95%), less than KEPCO Engineering & Construction Co., Inc. (1.63%), greater than Sanil Electric Co., Ltd. (0%), greater than Taihan Cable & Solution Co., Ltd. (0%), less than CJ Corporation (2.65%), less than CJ Corporation (2.65%), less than Hyundai Engineering & Construction Co.,Ltd. (0.95%), less than GS Holdings Corp. (3.57%), less than GS Holdings Corp. (3.57%), less than LS Corp. (1.03%),
| Company | Dividend Yield | Market cap |
|---|---|---|
| 0.95% | $9.42T | |
| 1.63% | $3.13T | |
| 0% | $3.90T | |
| 0% | $4.12T | |
| 2.65% | $3.23T | |
| 2.65% | $3.37T | |
| 0.95% | $9.42T | |
| 3.57% | $6.80T | |
| 3.57% | $7.81T | |
| 1.03% | $6.75T |
Build a custom stock screener for Samsung Engineering Co., Ltd. (028050.KS) and other stocks
One of the best ways to find valuable stocks to invest in is to build a custom made screener in your Excel or Google Sheets spreadsheet. This allows you to compare thousands of companies like Samsung Engineering Co., Ltd. using the financials and key metrics that matter to you in a single view.
The easiest way to set this up is to use the Wisesheets add-on and set your spreadsheet like this:
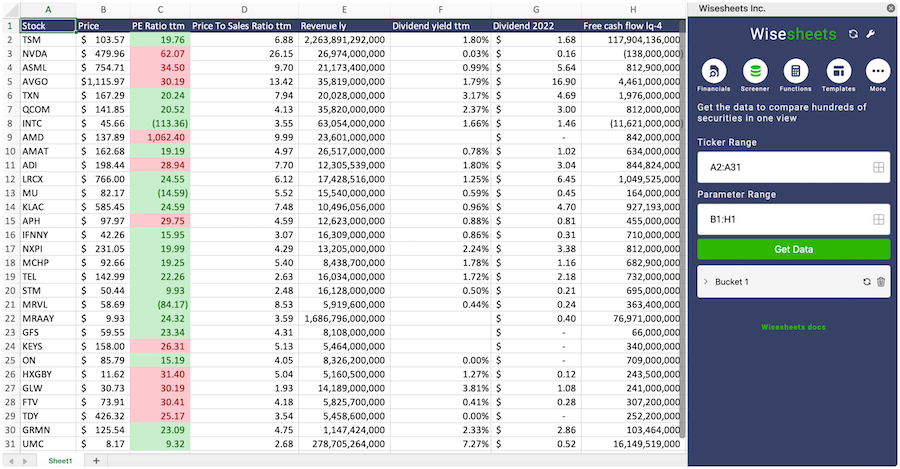
Covering all these metrics from financial, data, dividend data, key metrics and more you can get all the data you want for over 50+ exchanges worldwide.
Get your free trial here.
Samsung Engineering Co., Ltd. (028050.KS) and other stocks custom spreadsheet templates
The easiest way to analyze a company like Samsung Engineering Co., Ltd. or any others is to create a spreadsheet model that automatically retrieves all of the stock data you need.
Using Wisesheets you can set up a spreadsheet model like this with simple spreadsheet formulas. If you change the ticker you can get all of the data automatically updated for you.
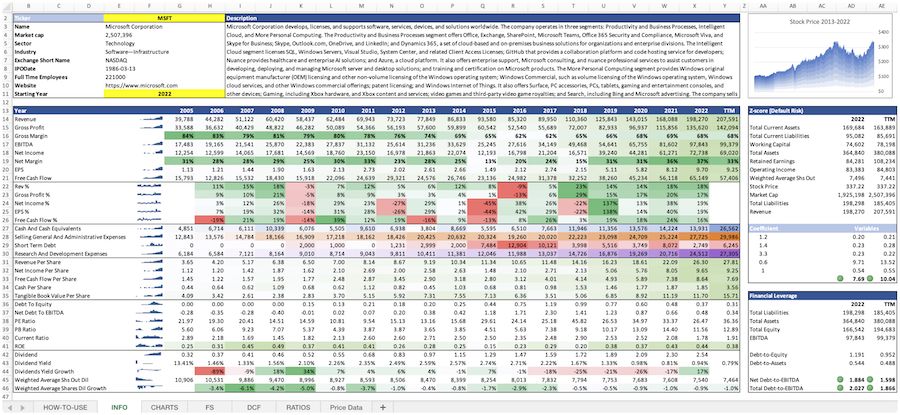
Whether you need live data, historical price data, financials, dividend data, key metrics, analyst estimates, or anything else...Wisesheets has you covered.
Frequently asked questions❓
What is the Dividend Yield?
How can you use the Dividend Yield?
What is Samsung Engineering Co., Ltd.'s Dividend Yield?
How is the Dividend Yield calculated for Samsung Engineering Co., Ltd. (028050.KS)?
What is the highest Dividend Yield for Samsung Engineering Co., Ltd. (028050.KS)?
What is the 3-year average Dividend Yield for Samsung Engineering Co., Ltd. (028050.KS)?
What is the 5-year average Dividend Yield for Samsung Engineering Co., Ltd. (028050.KS)?
How does the current Dividend Yield for Samsung Engineering Co., Ltd. (028050.KS) compare to its historical average?