Guardant Health, Inc.
GH
Price:
$110.48
Market Cap:
$14.29B
Guardant Health, Inc., a precision oncology company, provides blood tests, data sets, and analytics in the United States and internationally. The company offers Guardant360, Guardant360 LDT, Guardant360 CDx, and GuardantOMNI liquid biopsy-based tests for advanced stage cancer; and GuardantINFORM, an in-silico research platform that comprise a clinical-genomic liquid biopsy dataset of advanced cancer patients. It is also developing LUNAR-2 test for the early detection of colorectal cancer in asymptomatic individuals eligible; and GuardantConnect, an integrated software-based solution for clinical and biopharmaceutical customers seeking to connect patients tested with the Guardant360 assay wit...[Read more]
Industry
Medical - Diagnostics & Research
IPO Date
2018-10-04
Stock Exchange
NASDAQ
Ticker
GH
PE Ratio
[-34.31]
ROE
[151.86%]
Current Ratio
[3.50]
Dividend Yield
[0%]
Enterprise Value
[15.04B]
Dividend History
The Current Ratio as of January 2026 (TTM) for Guardant Health, Inc. (GH) is 3.50
According to Guardant Health, Inc.’s latest financial reports and current stock price. The company's current Current Ratio is 3.50. This represents a change of -12.47% compared to the average of 4.00 of the last 4 quarters.
Guardant Health, Inc. (GH) Historical Current Ratio (quarterly & annually)
How has GH Current Ratio performed in the past?
The mean historical Current Ratio of Guardant Health, Inc. over the last ten years is 9.91. The current 3.50 Current Ratio has changed 3.43% with respect to the historical average. Over the past ten years (40 quarters), GH's Current Ratio was at its highest in in the December 2020 quarter at 28.27. The Current Ratio was at its lowest in in the March 2017 quarter at 0.
Average
9.91
Median
7.22
Minimum
4.68
Maximum
28.27
Guardant Health, Inc. (GH) Current Ratio by Quarter and Year
Discovering the peaks and valleys of Guardant Health, Inc. Current Ratio, unveiling quarterly and yearly fluctuations to gain insights into the company’s financial performance and market dynamics, offering valuable data for investors and analysts alike.
Maximum Annual Increase = 244.15%
Maximum Annual Current Ratio = 28.27
Minimum Annual Increase = -79.75%
Minimum Annual Current Ratio = 4.68
| Year | Current Ratio | Change |
|---|---|---|
| 2024 | 4.68 | -28.50% |
| 2023 | 6.54 | 6.08% |
| 2022 | 6.17 | 7.77% |
| 2021 | 5.72 | -79.75% |
| 2020 | 28.27 | 244.15% |
| 2019 | 8.21 | -17.79% |
| 2018 | 9.99 | -19.29% |
| 2017 | 12.38 | 71.43% |
Guardant Health, Inc. (GH) Average Current Ratio
How has GH Current Ratio performed in the past?
The current Current Ratio of Guardant Health, Inc. (GH) is less than than its 3-year, less than than its 5-year, and less than than its 10-year historical averages
3-year avg
5.80
5-year avg
10.27
10-year avg
9.91
Guardant Health, Inc. (GH) Current Ratio vs. Peers
How is GH’s Current Ratio compared to its peers?
Guardant Health, Inc.’s Current Ratio is greater than Exact Sciences Corporation (2.72), greater than ICON Public Limited Company (1.06), greater than Revvity, Inc. (1.75), greater than Ascendis Pharma A/S (1.03), greater than Viatris Inc. (1.35), greater than Qiagen N.V. (2.60), greater than Ionis Pharmaceuticals, Inc. (2.79), less than BridgeBio Pharma, Inc. (3.88), greater than Solventum Corporation (1.50), greater than Encompass Health Corporation (1.14),
| Company | Current Ratio | Market cap |
|---|---|---|
| 2.72 | $19.43B | |
| 1.06 | $14.19B | |
| 1.75 | $12.59B | |
| 1.03 | $13.68B | |
| 1.35 | $15.05B | |
| 2.60 | $11.06B | |
| 2.79 | $13.59B | |
| 3.88 | $15.24B | |
| 1.50 | $13.27B | |
| 1.14 | $9.52B |
Build a custom stock screener for Guardant Health, Inc. (GH) and other stocks
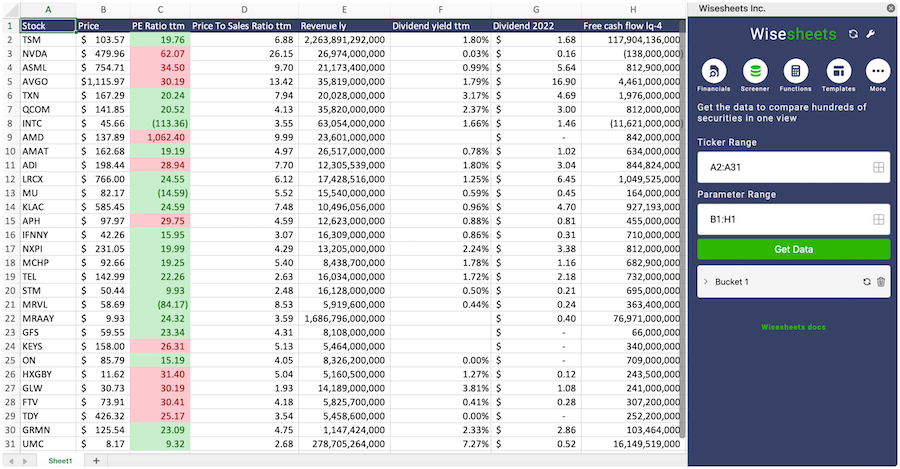
One of the best ways to find valuable stocks to invest in is to build a custom made screener in your Excel or Google Sheets spreadsheet. This allows you to compare thousands of companies like Guardant Health, Inc. using the financials and key metrics that matter to you in a single view.
The easiest way to set this up is to use the Wisesheets add-on and set your spreadsheet like this:
Covering all these metrics from financial, data, dividend data, key metrics and more you can get all the data you want for over 50+ exchanges worldwide.
Get your free trial here.
Guardant Health, Inc. (GH) and other stocks custom spreadsheet templates
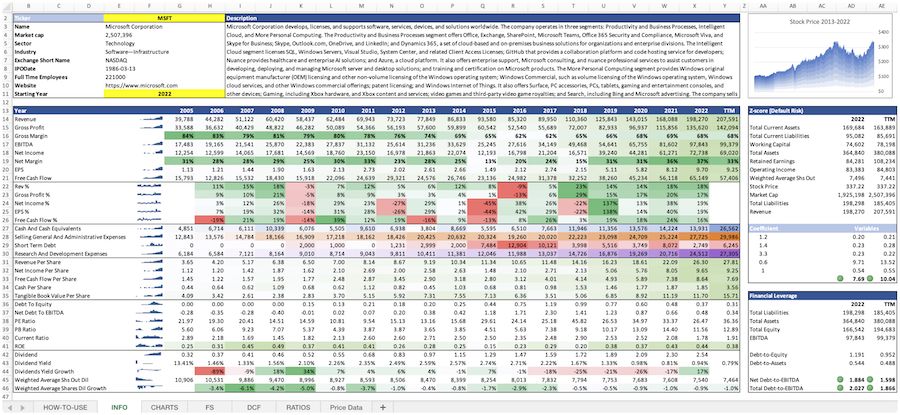
The easiest way to analyze a company like Guardant Health, Inc. or any others is to create a spreadsheet model that automatically retrieves all of the stock data you need.
Using Wisesheets you can set up a spreadsheet model like this with simple spreadsheet formulas. If you change the ticker you can get all of the data automatically updated for you.
Whether you need live data, historical price data, financials, dividend data, key metrics, analyst estimates, or anything else...Wisesheets has you covered.
Frequently asked questions❓
What is the Current Ratio?
How can you use the Current Ratio?
What is Guardant Health, Inc.'s Current Ratio?
How is the Current Ratio calculated for Guardant Health, Inc. (GH)?
What is the highest Current Ratio for Guardant Health, Inc. (GH)?
What is the 3-year average Current Ratio for Guardant Health, Inc. (GH)?
What is the 5-year average Current Ratio for Guardant Health, Inc. (GH)?
How does the current Current Ratio for Guardant Health, Inc. (GH) compare to its historical average?

